




Study design, setting, and data sources
We conducted an observational longitudinal network study of retweet amplification in U.S. e-cigarette prevention discourse on Twitter/X from January 2014 through April 2023, when the platform was named Twitter (renamed X in July 2023); we use “Twitter/X” for the platform and retain the contemporaneous terms “tweet” and “retweet” for the content analyzed. Retweets were treated as diffusion ties to capture amplification dynamics, rather than conversational interactions17.
Public Twitter/X data were collected monthly using hundreds of keyword search rules for broad data collection on the topic of tobacco control, via the Historical PowerTrack and Academic Research APIs. These rules yielded millions of tweets per month, from which the campaign-relevant subset described below was extracted. The data were used in accordance with Twitter’s Terms of Service, and the study was classified as exempt under Category 4 (secondary research involving publicly available data) by the Institutional Review Board at NORC at the University of Chicago (approved July 12, 2023). We then developed a list of e-cigarette prevention campaigns that were active during the period of 2014–2023. We included one tobacco prevention campaign (Fresh Empire) targeting combustible products that appeared in tweets about e-cigarettes. Using a list of campaign-specific hashtags, institutional user handles, and supplemental keywords (Table 1), we extracted a subset of our Twitter/X data that matched prevention efforts active during the period.
Records from January 2014–December 2019 were obtained via the Historical PowerTrack API; records from January 2020–April 2023 were obtained using the Academic Research API following a change in platform access. Partial year 2023 data (January–April) were retained to provide continuity in descriptive analysis but were excluded from statistical trend analyses.
To minimize off-topic content, we applied a campaign-specific filter composed of regular expressions and inclusion rules developed through iterative review. For example, tweets from institutional accounts such as @FDATobacco were retained only when at least one campaign hashtag was present. Inclusion criteria required at least one campaign-relevant retweet within a given year. Annual networks were therefore constructed from users appearing in the year-specific retweet edge list (as retweeters or retweeted accounts). Retweets involving accounts without a final classification were excluded, yielding 199,504 retweets for analysis. A data-flow diagram appears in Supplementary Figure 1.
Account classification and human validation
To examine the roles of different actors, we classified all unique users in the analytic data into five mutually exclusive categories: Health (health-related organizations or individuals including public health agencies, healthcare providers, researchers, etc.), Commercial (organizations or brands promoting or selling tobacco products), Vape Community (organizations or individuals promoting e-cigarette use or pro-e-cigarette policies/agendas), Organic (individual users without public or institutional affiliations), and Other (accounts not classified in the preceding categories, such as media aggregators or organizations without sufficient information for attribution).
User classification followed a two-step process combining large language model (LLM)-based classification with human validation. First, we used GPT-4o on Microsoft Azure to classify all unique users in the analytic data into five mutually exclusive categories, using a structured prompt (full prompt available in Supplementary Information). Since Twitter/X display names and usernames are non-unique and mutable, we classified each unique user ID based on the observation with the highest follower count, aiming to select the most complete, most recent metadata for that account. Account classifications were merged with the annual retweet-network data for category-specific analyses.
In the full dataset of unique user IDs, Organic Users accounted for 62.2% of accounts, while Health Actors (2.3%), Vape Community (2.0%), and Commercial accounts (1.3%) were relatively rare. To ensure adequate representation of these low-prevalence categories, the human validation sample was stratified by model-assigned account type, resulting in over-sampling of rarer classes and under-sampling of more prevalent ones.
To validate LLM-based classifications, we first drew a random sample of 160 accounts and one example tweet per account for double-coding by two trained coders to assess interrater reliability. Coders assigned account-level labels using a grounded theory–informed codebook. Reliability was high for the Health, Commercial, Vape Community, and Other categories (AC1 > 0.80), and moderate for the Organic category (AC1 = 0.76)18. We then drew a random sample of 200 unique Twitter/X users, stratified by user category (40 per category) to ensure balance across account categories. Coders independently reviewed each unique user and assigned account-level labels; disagreements were adjudicated by a senior coder, and the adjudicated labels served as the reference standard for evaluating GPT-4o classification performance. Human coders could consult up to ten recent tweets to resolve ambiguous cases, whereas the classifier received a single example tweet, so reported performance reflects agreement against a more fully informed standard.
Additional classification details, class-specific precision, recall, and F1 scores, the labeling codebook used by human coders, and the full structured prompt and output schema are provided in the Supplementary Information.
Across categories, the classifier achieved a F1 score of 0.86 (both weighted and macro). Performance was highest for Health accounts (F1 = 0.95) and Organic accounts (F1 = 0.86), with slightly lower performance for Commercial (F1 = 0.85), Other accounts (F1 = 0.83), and Vape Community (F1 = 0.80).
Network construction and measures
The choice of retweets as the unit of analysis is deliberate because this study focuses on diffusion-network position rather than all forms of campaign communication. Retweets are a central diffusion mechanism on Twitter/X: they propagate content across follower networks, increase repeated exposure, and generate cascading visibility19,20. We therefore interpret retweet ties as content-mediated amplification events. The resulting retweet topology is an outcome of users’ sharing decisions, not a structure independent of content. Health actors communicate through multiple interaction types, including original tweets, replies, quote tweets, and retweets; however, these interaction types serve different communicative functions and generate different network structures. Because structural fragility concerns whether public health actors remain embedded in the pathways through which campaign messages are amplified, retweets provide an appropriate operationalization of diffusion-network position. This focus also makes the scope of inference explicit: the analysis evaluates Health actors’ position in retweet-based diffusion networks rather than their total communicative activity on Twitter/X.
For each calendar year (2014–2023), we constructed a directed, weighted retweet graph from the campaign-relevant corpus. Each node represents a unique user who retweeted or was retweeted at least once during that year. A directed edge from user A to B indicates that A retweeted B; multiple retweets within a year were collapsed into a single weighted edge with dyad-year weight equal to the aggregated number of retweets between the pair. We did not impose a minimum degree threshold; node-level metrics were computed for all accounts present in each annual retweet graph.
Measures were bound to specific graph types. Density was computed on the directed retweet graph. Modularity (subgroup separation; 0–1 scale, with higher values indicating greater community segregation) was computed on the undirected weighted projection of the retweet graph after removing self-loops21. Eigenvector centrality was computed on the undirected weighted projection; when the projected graph was disconnected, eigenvector centrality was computed on the largest connected component (LCC), with nodes outside the LCC assigned a value of 0. The LCC ratio was defined as the proportion of nodes in the LCC of the undirected projection. PageRank was computed on the full directed, weighted retweet network with damping factor of 0.85 and uniform redistribution of dangling mass; category-level PageRank mass was summarized as the sum of PageRank values within each category. K-core analyses were conducted on the undirected projection. Attribute assortativity by category was computed on the unweighted undirected projection after removing self-loops, whereas within-category retweet share was computed on weighted retweet events. The two homophily indicators therefore capture related but distinct aspects of network segregation.
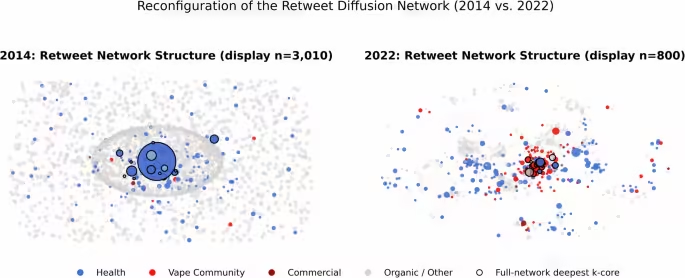
Primary indicators were: (1) core embedding, operationalized as category shares of deepest k-core membership; (2) network visibility, captured by category-level PageRank mass and in-strength totals (and their corresponding category shares); and (3) community integration, assessed using modularity and the LCC ratio. Secondary indicators included in-degree per 1,000 category members (per-capita amplification efficiency)22, assortativity by category (the tendency for similar nodes to connect in the network; −1 indicating disassortative mixing; +1 indicating assortative mixing)23, within-category retweet share (the proportion of retweets occurring between users of the same category), amplification probability (the proportion of accounts in each category retweeted by at least one other account; reported in Supplementary Tables 5–9), and eigenvector concentration (the extent to which centrality is concentrated among a small subset of nodes). Additional results for secondary indicators are provided in the Supplementary Information.
Operationalization of structural fragility and the bunker effect
We conceptualized structural fragility as a declining capacity of Health actors to sustain amplification and cross-community embedding in the diffusion network. Positional fragility was assessed via in-strength, in-degree, amplification probability (reported in Supplementary Tables 5–9), eigenvector centrality, PageRank, and per-capita amplification efficiency. Community fragility was assessed via modularity, LCC ratio, assortativity by category, and within-category retweet share. Core fragility was assessed via deepest k-core size and composition.
A year was classified as “bunker consistent” relative to the 2014–2015 baseline when modularity increased, the LCC ratio decreased, and within-category retweet concentration and assortativity increased, indicating a contracted, internally reinforcing topology that restricts cross-community diffusion.
Statistics and reproducibility
Primary network measures were computed in Python 3.14 using NetworkX 3.6.1, with main-analysis community partitions identified using the Louvain algorithm implemented in python-louvain 0.16 at default resolution24. The degree-preserving null analysis reported in Supplementary Table 4 used python-igraph 1.0.0 for graph rewiring and multilevel community detection, applying the same implementation to observed and randomized networks.
Annual trends (2014–2022) were evaluated using Mann–Kendall tests with tie-adjusted variance and the standard continuity correction, together with Theil–Sen estimates of median annual slope (Supplementary Table 1). For the two community-fragility indicators, modularity and largest connected component ratio, we additionally estimated ordinary least squares models with classical standard errors. Activity-adjusted analyses of Health amplification used the same estimator, with the annual number of participating Health accounts included as an additional covariate. Because adjacent annual network measures may be serially dependent, neither the classical standard errors nor the Mann–Kendall p-values fully account for temporal dependence, and uncertainty may be understated under positive serial correlation. Trend tests were interpreted descriptively, and all tests were two-sided. Abrupt changes were assessed through visual inspection and year-to-year contrasts rather than assumed linearity.
To evaluate whether observed patterns exceeded chance expectations, we conducted two null-model analyses. The attribute-permutation null held the observed yearly topology fixed and randomly permuted actor-category labels across nodes 1,000 times. This preserves network size, edge structure, and the yearly number of nodes in each category, and was used to evaluate category assortativity, within-category retweet share, Health and Vape Community shares of deepest k-core membership, Health share of PageRank mass, and Health share of eigenvector mass. The degree-preserving configuration-model null randomized the undirected weighted projection using degree-preserving edge rewiring with 500 randomizations per year; the observed edge-weight multiset was reassigned to rewired edges. This null preserves the unweighted degree sequence and the overall weight distribution, but not each node’s weighted strength. It was used to evaluate Louvain modularity, LCC ratio, and deepest k-core depth relative to degree-matched random networks. Empirical p-values are two-sided and reported with observed values, null means, 95% null intervals, and z-scores in Supplementary Tables 3 and 4.
Quality checks verified that category-level PageRank mass summed to 1.0 and that deepest k-core category shares summed to 100% within each year. Code and data availability are described in the respective statements below.
Source: www.nature.com