





Outside of high school physics experiments, semiconductor manufacturing, and non-alc beer production, not much of life takes place in a vacuum. That’s why we at the Brewers Association (BA) endeavor to understand the financial realities of running a brewery every two years in our Financial Benchmarking Survey.
In late summer of this year, we released the results of that survey to our members. Pulling from full year 2025 data, the results include a look at revenue by category, sales per seat, distribution trends, cost of goods sold, operating expenses, margins, debt to asset ratios, AR/AP days aging, and so much more!
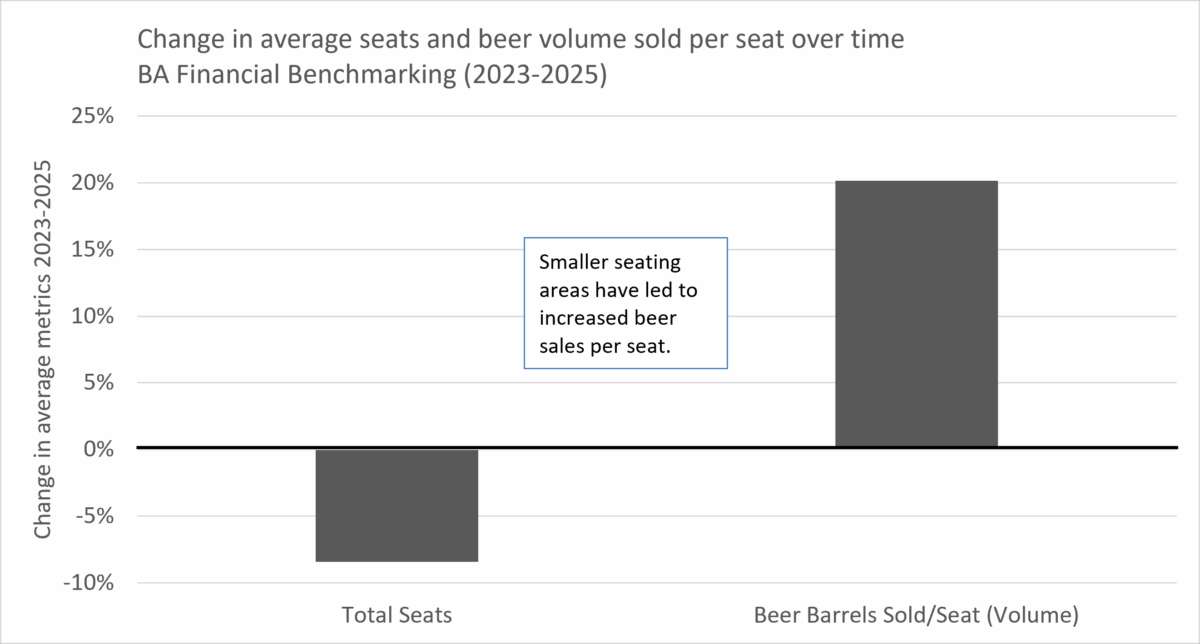
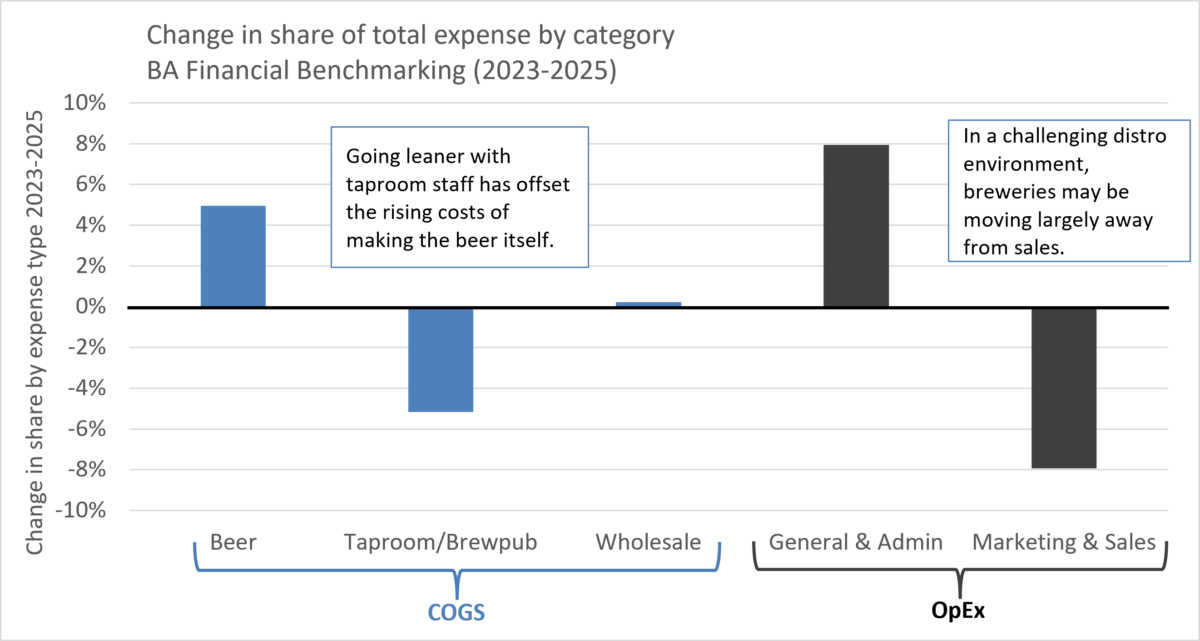
While dense in information, the results have a notable lack of beautiful charts and historical context. Which is why we gather here today. For those who can’t get enough of the numbers, here are some of the takeaways that stood out to me while I reviewed this year’s results compared to the previous survey assessing 2023 data.
Was this article helpful?
YesNo
Source: www.brewersassociation.org