





Frequency of release: Annual
Forthcoming release: Home Office statistics release calendar
Home Office responsible statistician: John Flatley
Press enquires: [email protected]. Telephone: 0300 123 3535
Public enquires: [email protected]
This release contains statistics about hate crime offences recorded by the police in England and Wales.
This release is accompanied by annual and appendix data tables.
Open data tables can be found at ‘Police recorded crime and outcomes open data tables’.
Key results
In the year ending March 2026, there were 146,825 hate crimes recorded by the police in England and Wales, a 7% increase compared with the previous year.
There was a 9% increase in race hate crimes and a 13% rise in religious hate crimes; and falls in sexual orientation (down 1%), disability (down 5%) and transgender (down 4%) hate crimes.
There were increases in religious hate crimes targeted at Muslims, up by 15%, and Jews, up by 10%.
1. Introduction
1.1 Overview
This statistical bulletin provides information on the number of hate crimes recorded by the police in England and Wales in the year ending March 2026.
Police forces have made significant improvements since 2014 in how they record crime. They have also improved their identification of what constitutes a hate crime. These changes mean police recorded crime figures do not provide reliable trends in hate crime since 2014. Figures from the police should also not be seen as a good measure of prevalence since not all hate crime is reported to them. The figures do, however, provide a good measure of the hate crime-related demand on the police.
1.2 Information on police recorded hate crime figures
In August 2025, His Majesty’s Inspectorate of Constabulary and Fire & Rescue Services (HMICFRS) published ‘How effectively do the police record crime? This report brought together findings from HMICFRS inspection programmes in recent years and outlines how the police have improved their crime recording. For more information, see Section 4: Police recorded hate crime data sources and quality.
Due to a change in crime recording systems in the Metropolitan Police Service (MPS) in February 2024, their data for the year ending March 2024 and 2025 is not directly comparable with that supplied to the Home Office prior to this change (see Section 4.2). Therefore, MPS data is excluded from the longer-term trend analysis in this bulletin.
1.3 Hate crime definitions
Hate crime is defined as ‘any criminal offence which is perceived, by the victim or any other person, to be motivated by hostility or prejudice towards someone based on a personal characteristic.’ This common definition was agreed in 2007 by the police, Crown Prosecution Service, Prison Service (now the HM Prison and Probation Service) and other agencies that make up the criminal justice system. There are 5 centrally monitored strands of hate crime:
- race or ethnicity
- religion
- sexual orientation
- disability
- transgender identity
In the process of recording a crime, the police can flag an offence as being motivated by one or more of these 5 monitored strands (for example, an offence can be motivated by hostility towards the victim’s race and religion). Hate crime figures in this bulletin are therefore dependent on a flag being correctly applied to an offence that is identified as a hate crime. For more information, see Section 4 – Hate Crime data sources and quality. The police can also record a specific racially or religiously aggravated offence as described in section 1.4.
The College of Policing (CoP) published updated guidance on how the police should respond to hate crime in October 2020. The Authorised Professional Practice guidance on hate crime sets out that:
A hate crime is any criminal offence which is perceived by the victim or any other person to be motivated by a hostility or prejudice based on:
- a person’s race or perceived race, or any racial group or ethnic background including countries within the UK and Gypsy and Traveller groups
- a person’s religion or perceived religion, or any religious group including those who have no faith in a theology
- a person’s sexual orientation or perceived sexual orientation, or any person’s sexual orientation
- a person’s disability or perceived disability, or any disability including physical disability, learning disability and mental health or developmental disorders
- a person who is transgender or perceived to be transgender, including people who are transsexual, transgender, cross dressers and those who hold a Gender Recognition Certificate under the Gender Recognition Act 2004
Race hate crimes can include offences with a xenophobic element (such as graffiti targeting certain nationalities or migrants).
Perceived religion of religious hate crime victims refers to the perceived religion targeted by the offender. While in the majority of offences the perceived and actual religion of the victim will be the same, in some cases they will differ. For example, if anti-Muslim graffiti is sprayed on a religious temple of another faith, this should be recorded as an offence of racially or religiously aggravated criminal damage and identified by the respective police force as a religious hate crime against Muslims. There are 9 different perceived religions covered, matching those 2021 Census groupings.
An offence may also be motivated by hatred towards a characteristic that is not currently centrally monitored and therefore does not form part of the data collection presented in this statistical bulletin (for example, age or sex).
Hate crimes are taken to mean any crime where the perpetrator’s hostility or prejudice against an identifiable group of people was a factor in determining who was victimised. While a crime may be recorded as a ‘hate crime’ at the start of an investigation, it may only be prosecuted as such if sufficient evidence of hostility is submitted as part of the case file.
Terrorist offences may or may not be considered a hate crime depending on the circumstances. A terrorist attack may be targeted against general British or Western values rather than one of the 5 specific strands. Attacks of this nature are therefore not covered by this statistical bulletin, although they will clearly be motivated by hate. However, other terrorist attacks are motivated by a hatred towards one of the centrally monitored hate crime strands covered by this statistical bulletin. For example, the Finsbury Park Mosque attack in June 2017 was classified as a hate crime because the victims were thought to be targeted because of their religious affiliation.
1.4 Hate crimes and racially or religiously aggravated offences
There are some offences in the main police recorded crime collection which have specific racially or religiously motivated elements defined by statute. These constitute a set of offences which are distinct from their non-racially or religiously aggravated equivalents (the full list of these is shown in Table 1.1). These racially or religiously aggravated offences are, by definition, considered to be hate crimes. Over a half (58%) of hate crime offences were recorded under one of these racially or religiously aggravated offences.
Table 1.1: The 5 racially or religiously aggravated offences and their non-aggravated equivalents
| Racially or religiously aggravated offences | Non-aggravated equivalent offences | ||
|---|---|---|---|
| Offence code | Offence description | Offence code | Offence description |
| 8P | Racially or religiously aggravated assault with injury | 8N | Assault with injury |
| 105B | Racially or religiously aggravated assault without injury | 105A | Assault without Injury |
| 8M | Racially or religiously aggravated harassment | 8L | Harassment |
| 9B | Racially or religiously aggravated public fear, alarm or distress | 9A | Public fear, alarm or distress |
| 58J | Racially or religiously aggravated criminal damage | 58A 58B 58C | Criminal damage to a dwelling Criminal damage to a building other than a dwelling Criminal damage to a vehicle Other criminal damage |
Source: Police recorded crime, Home Office
1.5 Non-Crime Hate Incidents (NCHI)
A NCHI is an act that is motivated by prejudice or hostility towards a person’s identity but does not amount to a criminal offence. The Home Office does not collect data on NCHIs from the police. Following the College of Policing and National Police Chiefs’ Council joint review of the use and effectiveness of NCHIs, and the Home Secretary’s acceptance of its recommendations, the recording of these incidents will be replaced by a new recording framework, due to be implemented in early 2027.
1.6 Crime survey for England and Wales (CSEW)
The CSEW is a face-to-face victimisation survey run by the Office for National Statistics (ONS) and provides estimates on hate crimes experienced by people resident in households in England and Wales. The size of the CSEW sample means the number of hate crime incidents and victims estimated in a single survey year is too unreliable to report on. Therefore, 3 annual datasets are combined to provide a larger sample which can be used to produce robust estimates for hate crime. Estimates for the combined surveys from the year ending March 2023 to the year ending March 2025 were published in the year ending March 2025 hate crime statistical bulletin, with the next estimates due to be published in 2028.
CSEW hate crime estimates are based on respondents to the survey stating that a crime incident was motivated by the offender’s attitude towards their race, religion, sexual orientation, disability or gender identity.
In contrast to police recorded crime, the CSEW is unaffected by changes in police recording practices, reporting rates or police activity, and it includes crimes that do not come to the attention of the police. However, the CSEW does not cover crimes against businesses or those not resident in households (for example, short-term visitors, or people living in institutions – such as care homes). It also excludes homicides and crimes that are termed “victimless”, such as many public order offences, which account for over half of police recorded hate crime. Differences between the measurement of hate crime in the CSEW and police recorded crime are outlined in Section 4.4.
2. Police recorded hate crime
Key results
In the year ending March 2026, there were 146,825 hate crimes recorded by the police in England and Wales, a 7% increase compared with the previous year (when there were 137,560 offences).
There was a 9% increase in race hate crimes and a 13% rise in religious hate crimes recorded by the police over the last year.
Within religious hate crimes, there was a 15% rise in hate crimes targeted at Muslims and a 10% increase in those targeted at Jews.
There were falls in the other 3 strands; sexual orientation hate crimes fell by 1%, disability hate crimes by 5% and transgender hate crimes by 4%.
2.1 Latest data and trends
Hate crimes are a subset of notifiable offences recorded by the police. In the year ending March 2026, 3% of such offences recorded by the police were identified as being hate crimes (excluding fraud).
There were 146,825 hate crimes recorded by the police in England and Wales in the year ending March 2026, a 7% increase compared with the previous year (when there were 137,560 offences; see Table 2.1).
Race hate crimes increased by 9% over the last year, to 107,926 offences, and religious hate crimes rose by 13%, to 11,419 offences. In contrast, there were falls in sexual orientation hate crimes, which were down 1%, disability hate crimes, down 5%, and transgender hate crimes, which fell by 4% (Table 2.1)
Table 2.1: Hate crimes recorded by the police by monitored strand, year ending March 2025 to year ending March 2026, England and Wales
Hate crime strand | 2024/25 | 2025/26 | Percentage change 2024/25 to 2025/26 |
|---|---|---|---|
| Race | 98,890 | 107,926 | 9 |
| Religion | 10,067 | 11,419 | 13 |
| Sexual orientation | 21,527 | 21,407 | -1 |
| Disability | 10,649 | 10,140 | -5 |
| Transgender | 4,120 | 3,955 | -4 |
| Total number of motivating factors | 145,253 | 154,847 | 7 |
| Total number of offences | 137,560 | 146,825 | 7 |
Source: Police recorded crime, Home Office
Due to a change in crime recording systems in the Metropolitan Police Service (MPS) in February 2024, their data for the year ending March 2025 and 2026 is not directly comparable with that supplied to the Home Office prior to this change (see Section 4.2). Therefore, MPS data is excluded from the longer-term trend analysis presented below.
The number of hate crimes recorded by the police increased from 31,844 offences in the year ending March 2013 to a peak of 128,485 offences in the year ending March 2022. This rise was thought to have been driven by improvements in crime recording by the police following a critical inspection by His Majesty’s Inspectorate of Constabulary and Fire & Rescue Services (HMICFRS) in 2014. This, in part, led to the removal of the designation of police recorded crime as Accredited Official Statistics. The number of hate crimes then fell for 2 consecutive years, to 113,166 offences in the year ending March 2024, before increasing again in the last 2 years.
Figure 2.1: Hate crimes recorded by the police (excluding the MPS), year ending March 2013 to year ending March 2026, England and Wales
Source: Police recorded crime, Home Office
The HMICFRS How effectively do the police record crime? report outlines how the percentage of crimes correctly recorded by the police has increase from an estimated 80.5% in 2014 to 94.8% for 2023 to 2025. For violent crime, this rose from 66.9% to 93.6% over the same period, showing that improved crime recording has had a particular marked impact on violent crime offences. It is thought that the recording of public order offences has also been similarly affected. These 2 offence groups accounted for over 9 in 10 (93%) of hate crime offences recorded in the last year (section 2.3). It is also thought that growing awareness of what constitutes hate crime has also led to improved identification of such offences by officers. Because of these changes, police recorded crime figures do not provide reliable trends in hate crime since 2014.
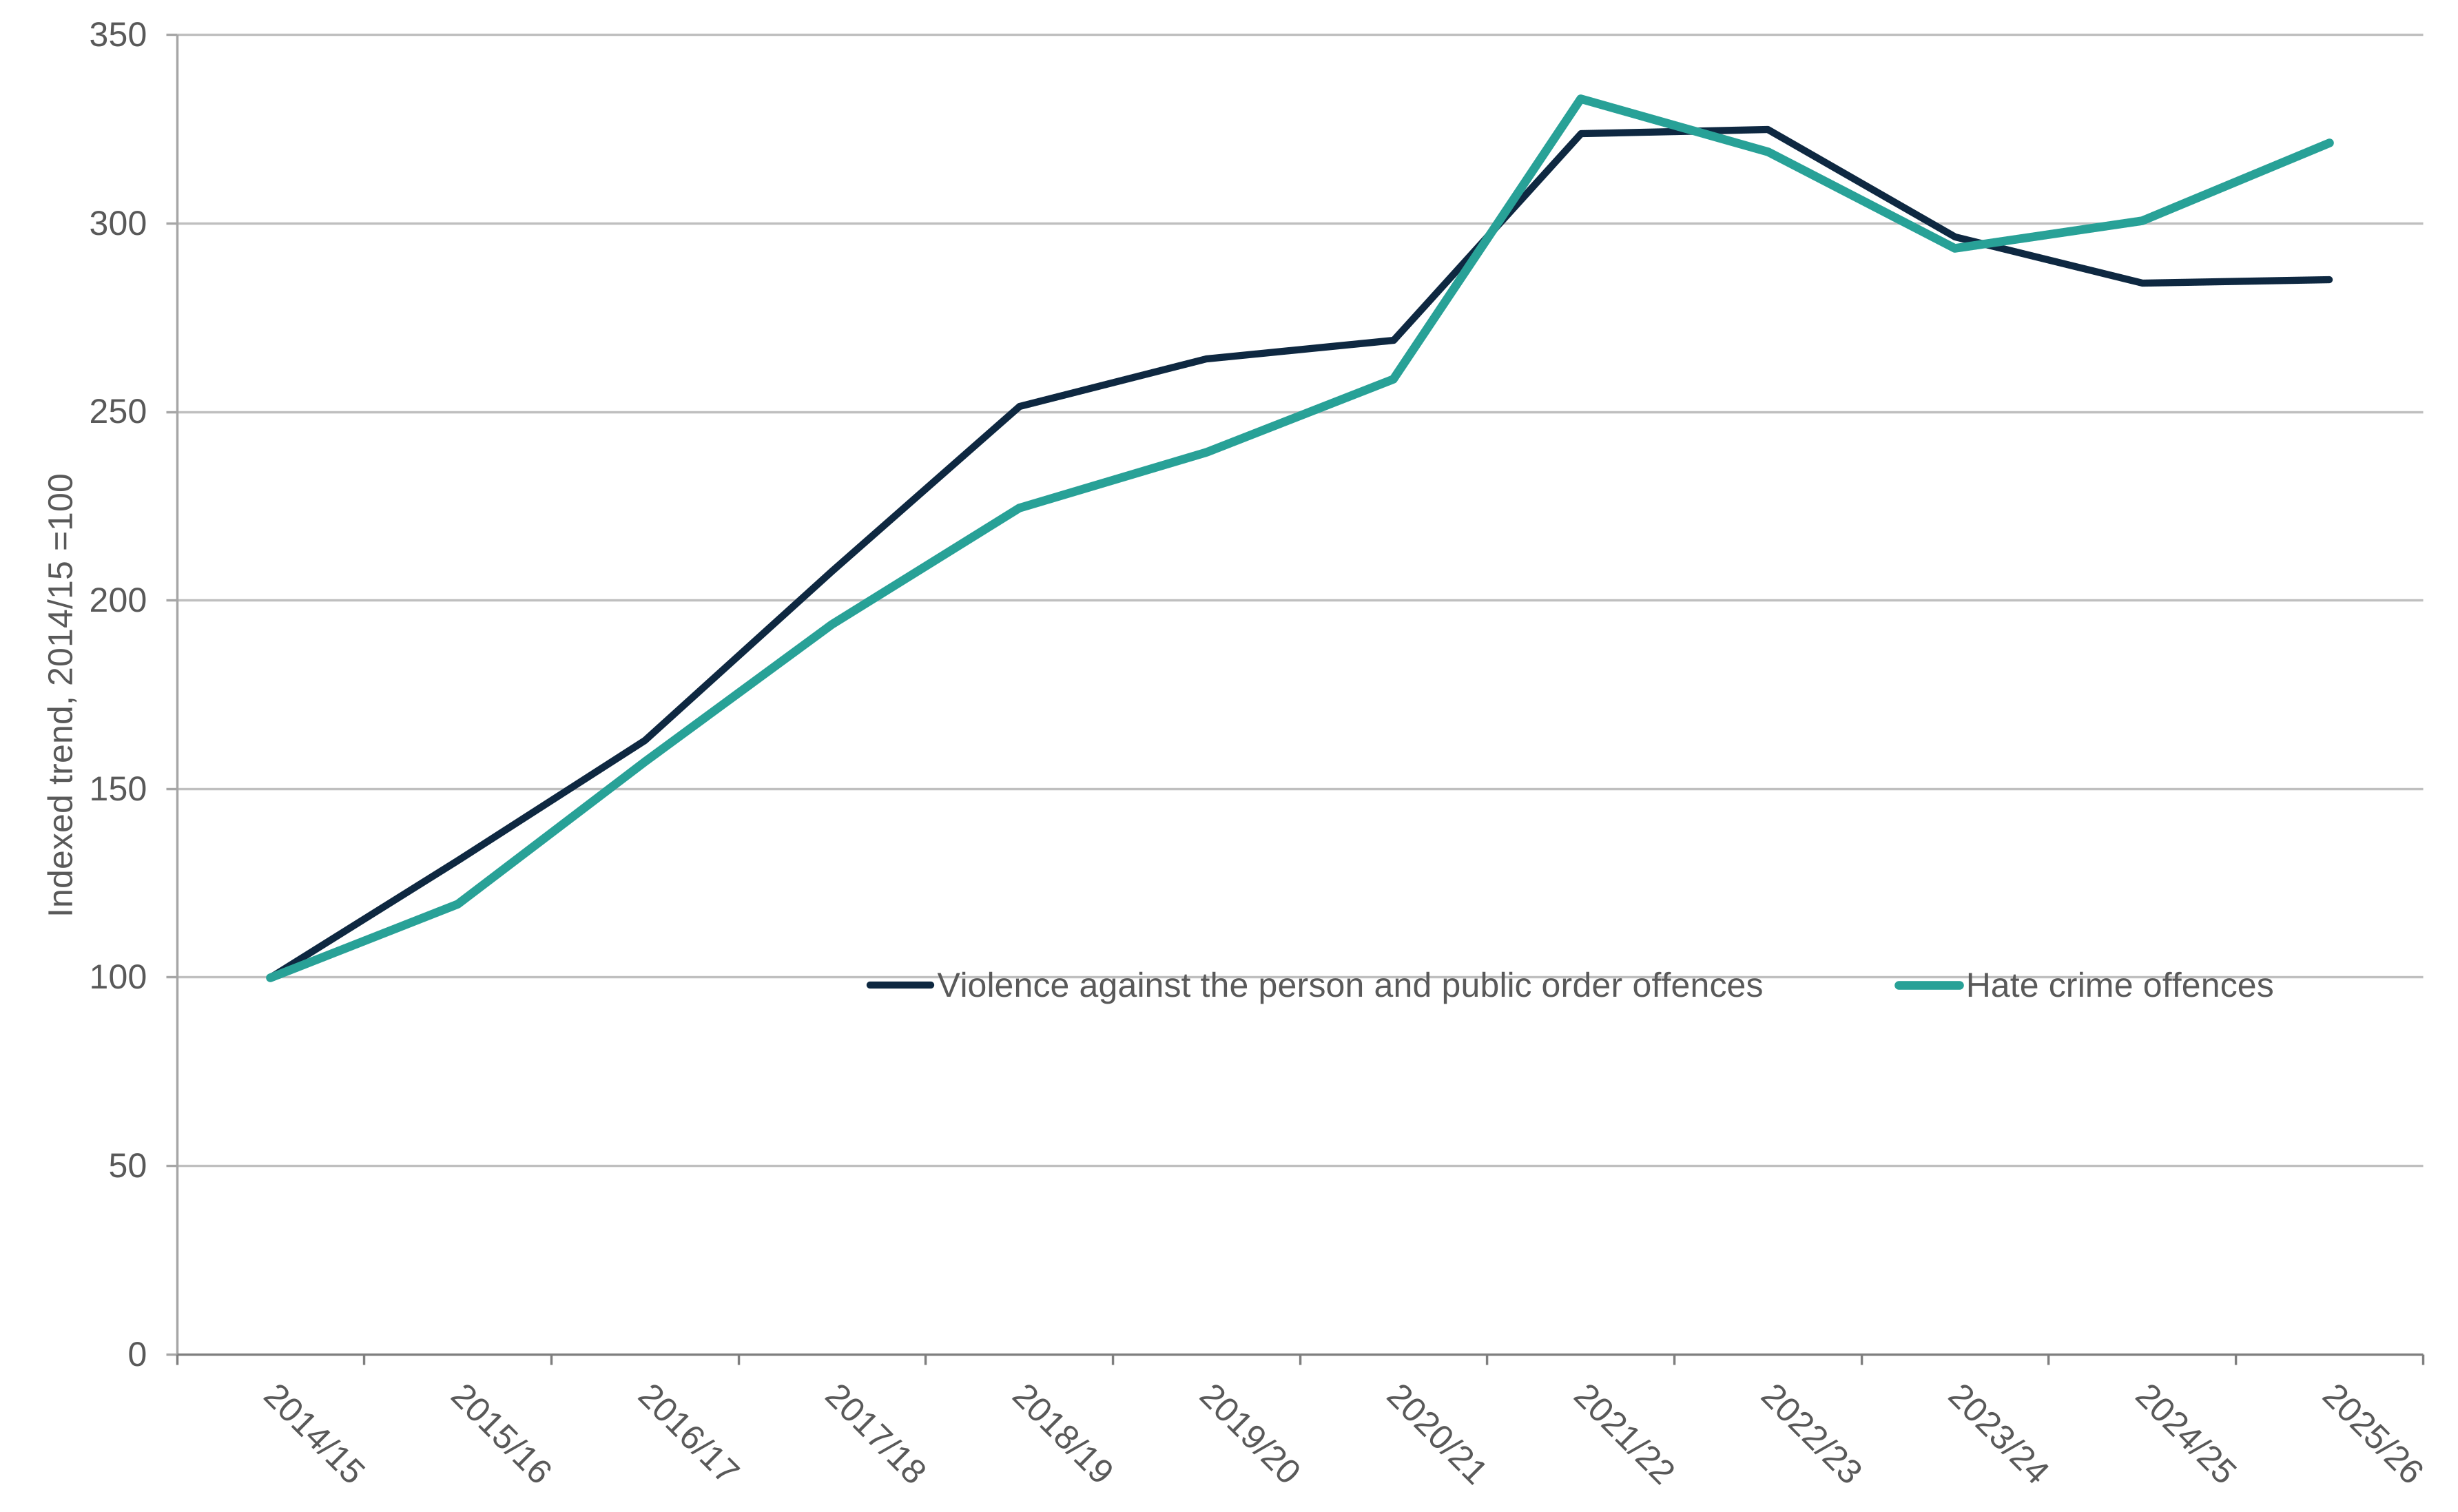
Figure 2.2 shows the indexed trend in overall violent and public order offences since the year ending March 2014 compared with all hate crime offences over the same period (excludes MPS). As can be seen, there is a strong correlation between the increase in overall public order and violence against the person offences and hate crime up to the year ending March 2022. This suggests that the improvements in crime recording were an important factor in such increases in police recorded hate crime.
In the last 2 years, there has been a rise in hate crime offences that is not seen in the overall violent and public order offences trend. This may suggest there has been a genuine increase in hate crime offences over the last 2 years.
Figure 2.2: Indexed trends in the number of police recorded violence against the person and public order and hate crime offences (excluding MPS), year ending March 2015 to year ending March 2026 (2014/15 = 100)
Source: Police recorded crime, Home Office
2.2 Hate crime by strand
Race hate crime
As in previous years, race accounted for the majority of police recorded hate crimes (74%; 107,926 offences). These offences increased by 9% over the last year (from 98,890). Longer-term trends data excluding the MPS shows that the 90,378 offences recorded in the latest year was the highest annual total since this data was first collected in the year ending March 2012.
The rise in these offences over the last year was due to an increase in public order offences, which went up by 10% (up 5,490 offences), and a 10% rise in assault without injury (up 1,460 offences).
Religious hate crime
There was a 13% increase in police recorded religious hate crime over the last year, from 10,067 to 11,419 offences. As with race hate crimes, the figure excluding the MPS, and at 8,214 offences, was the highest annual total since records began in the year ending March 2012.
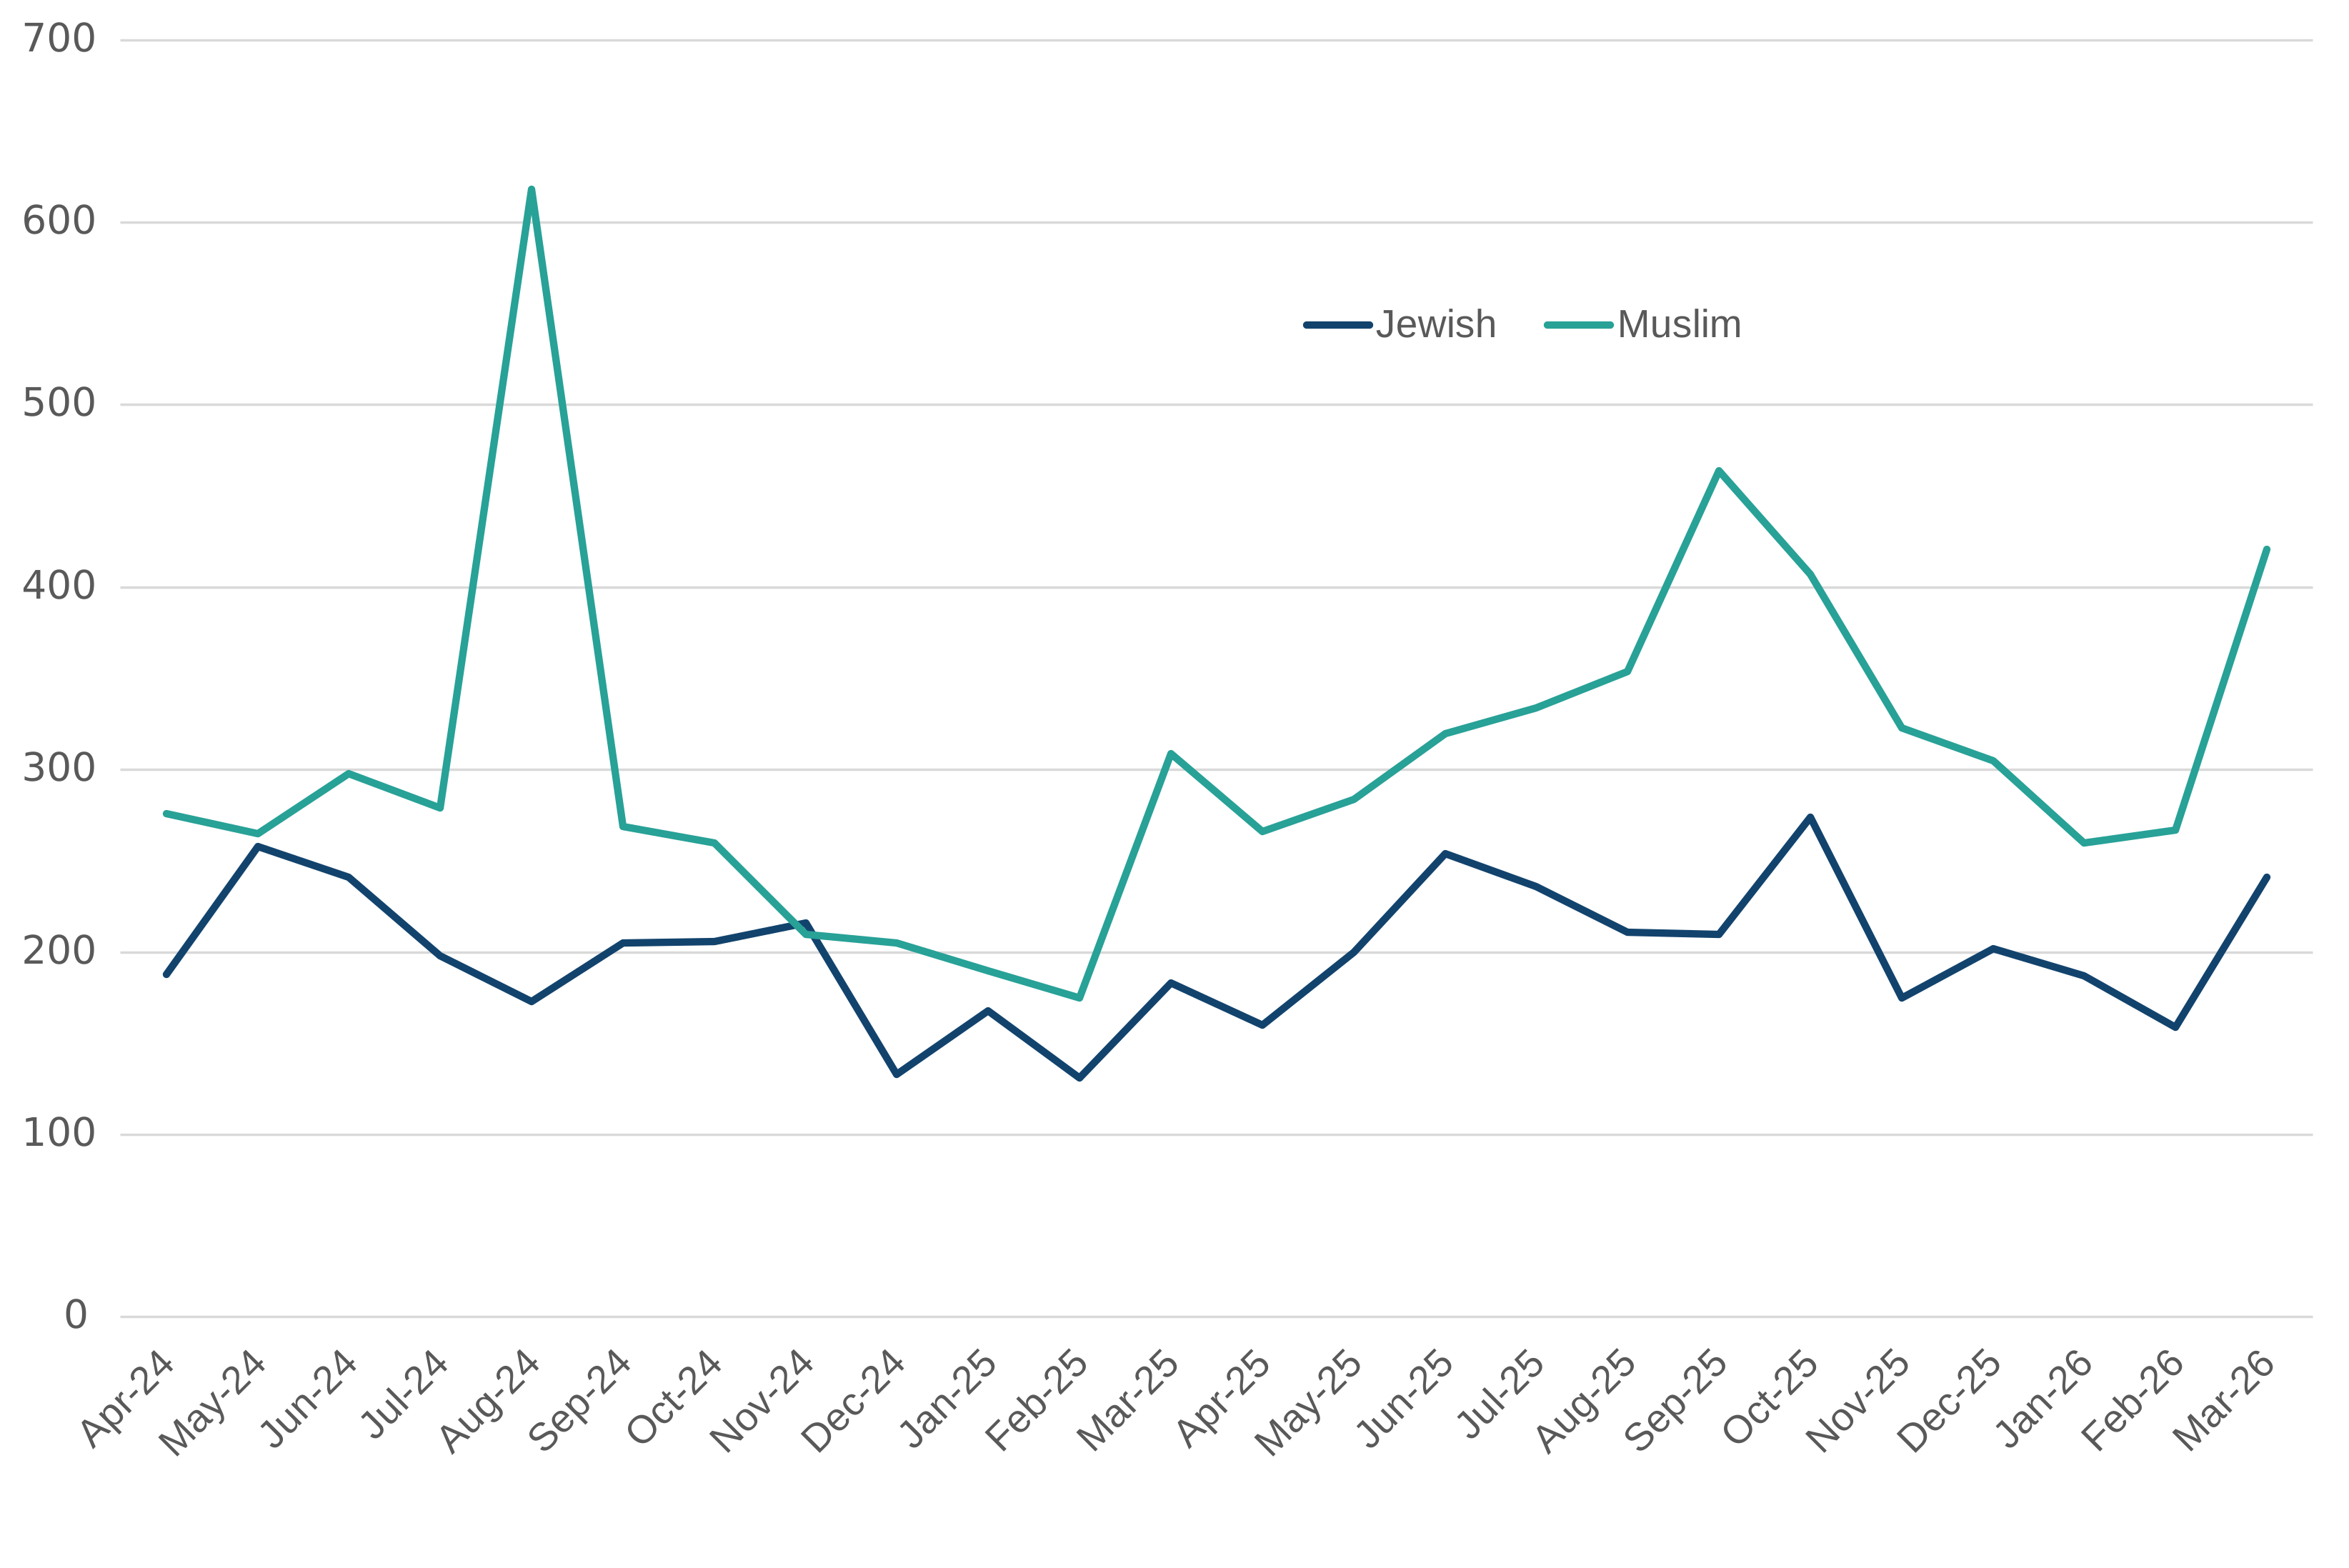
There was a 15% rise in religious hate crimes targeted at Muslims in the last year (from 4,479 to 5,132 offences). Figure 2.3, for 33 forces, shows a rise in these offences in September 2025, which coincided with a number of protests and incidents of public disorder, and March 2026, following the beginning of the USA-Iran conflict on the 28 February. These months represented the 2nd and 3rd highest monthly totals for these offences. The largest spike, recorded in August 2024, coincided with the Southport murders on the 29 July and the subsequent disorder across several English towns and cities. Excluding the MPS, these offences were at their highest annual level (3,660) since this data was first collected in the year ending March 2018.
The number of religious hate crimes targeted at Jewish people increased by 10%, from 2,874 to 3,162 offences. These spiked in October 2025, following a series of antisemitic crimes after the Heaton Park Synagogue terror attack and have been at an elevated level since the beginning of the Israel-Hamas conflict. Excluding the MPS, these offences were at their second highest annual level. The 2,003 offences in the latest year were slightly below the 2,093 recorded in the year ending March 2024, the year which saw the beginning of the Israel-Hamas conflict.
Figure 2.3 Number of religious hate crimes targeted against Jews and Muslims by month, year ending March 2025 and March 2026 (33 forces)
Source: Police recorded crime, Home Office
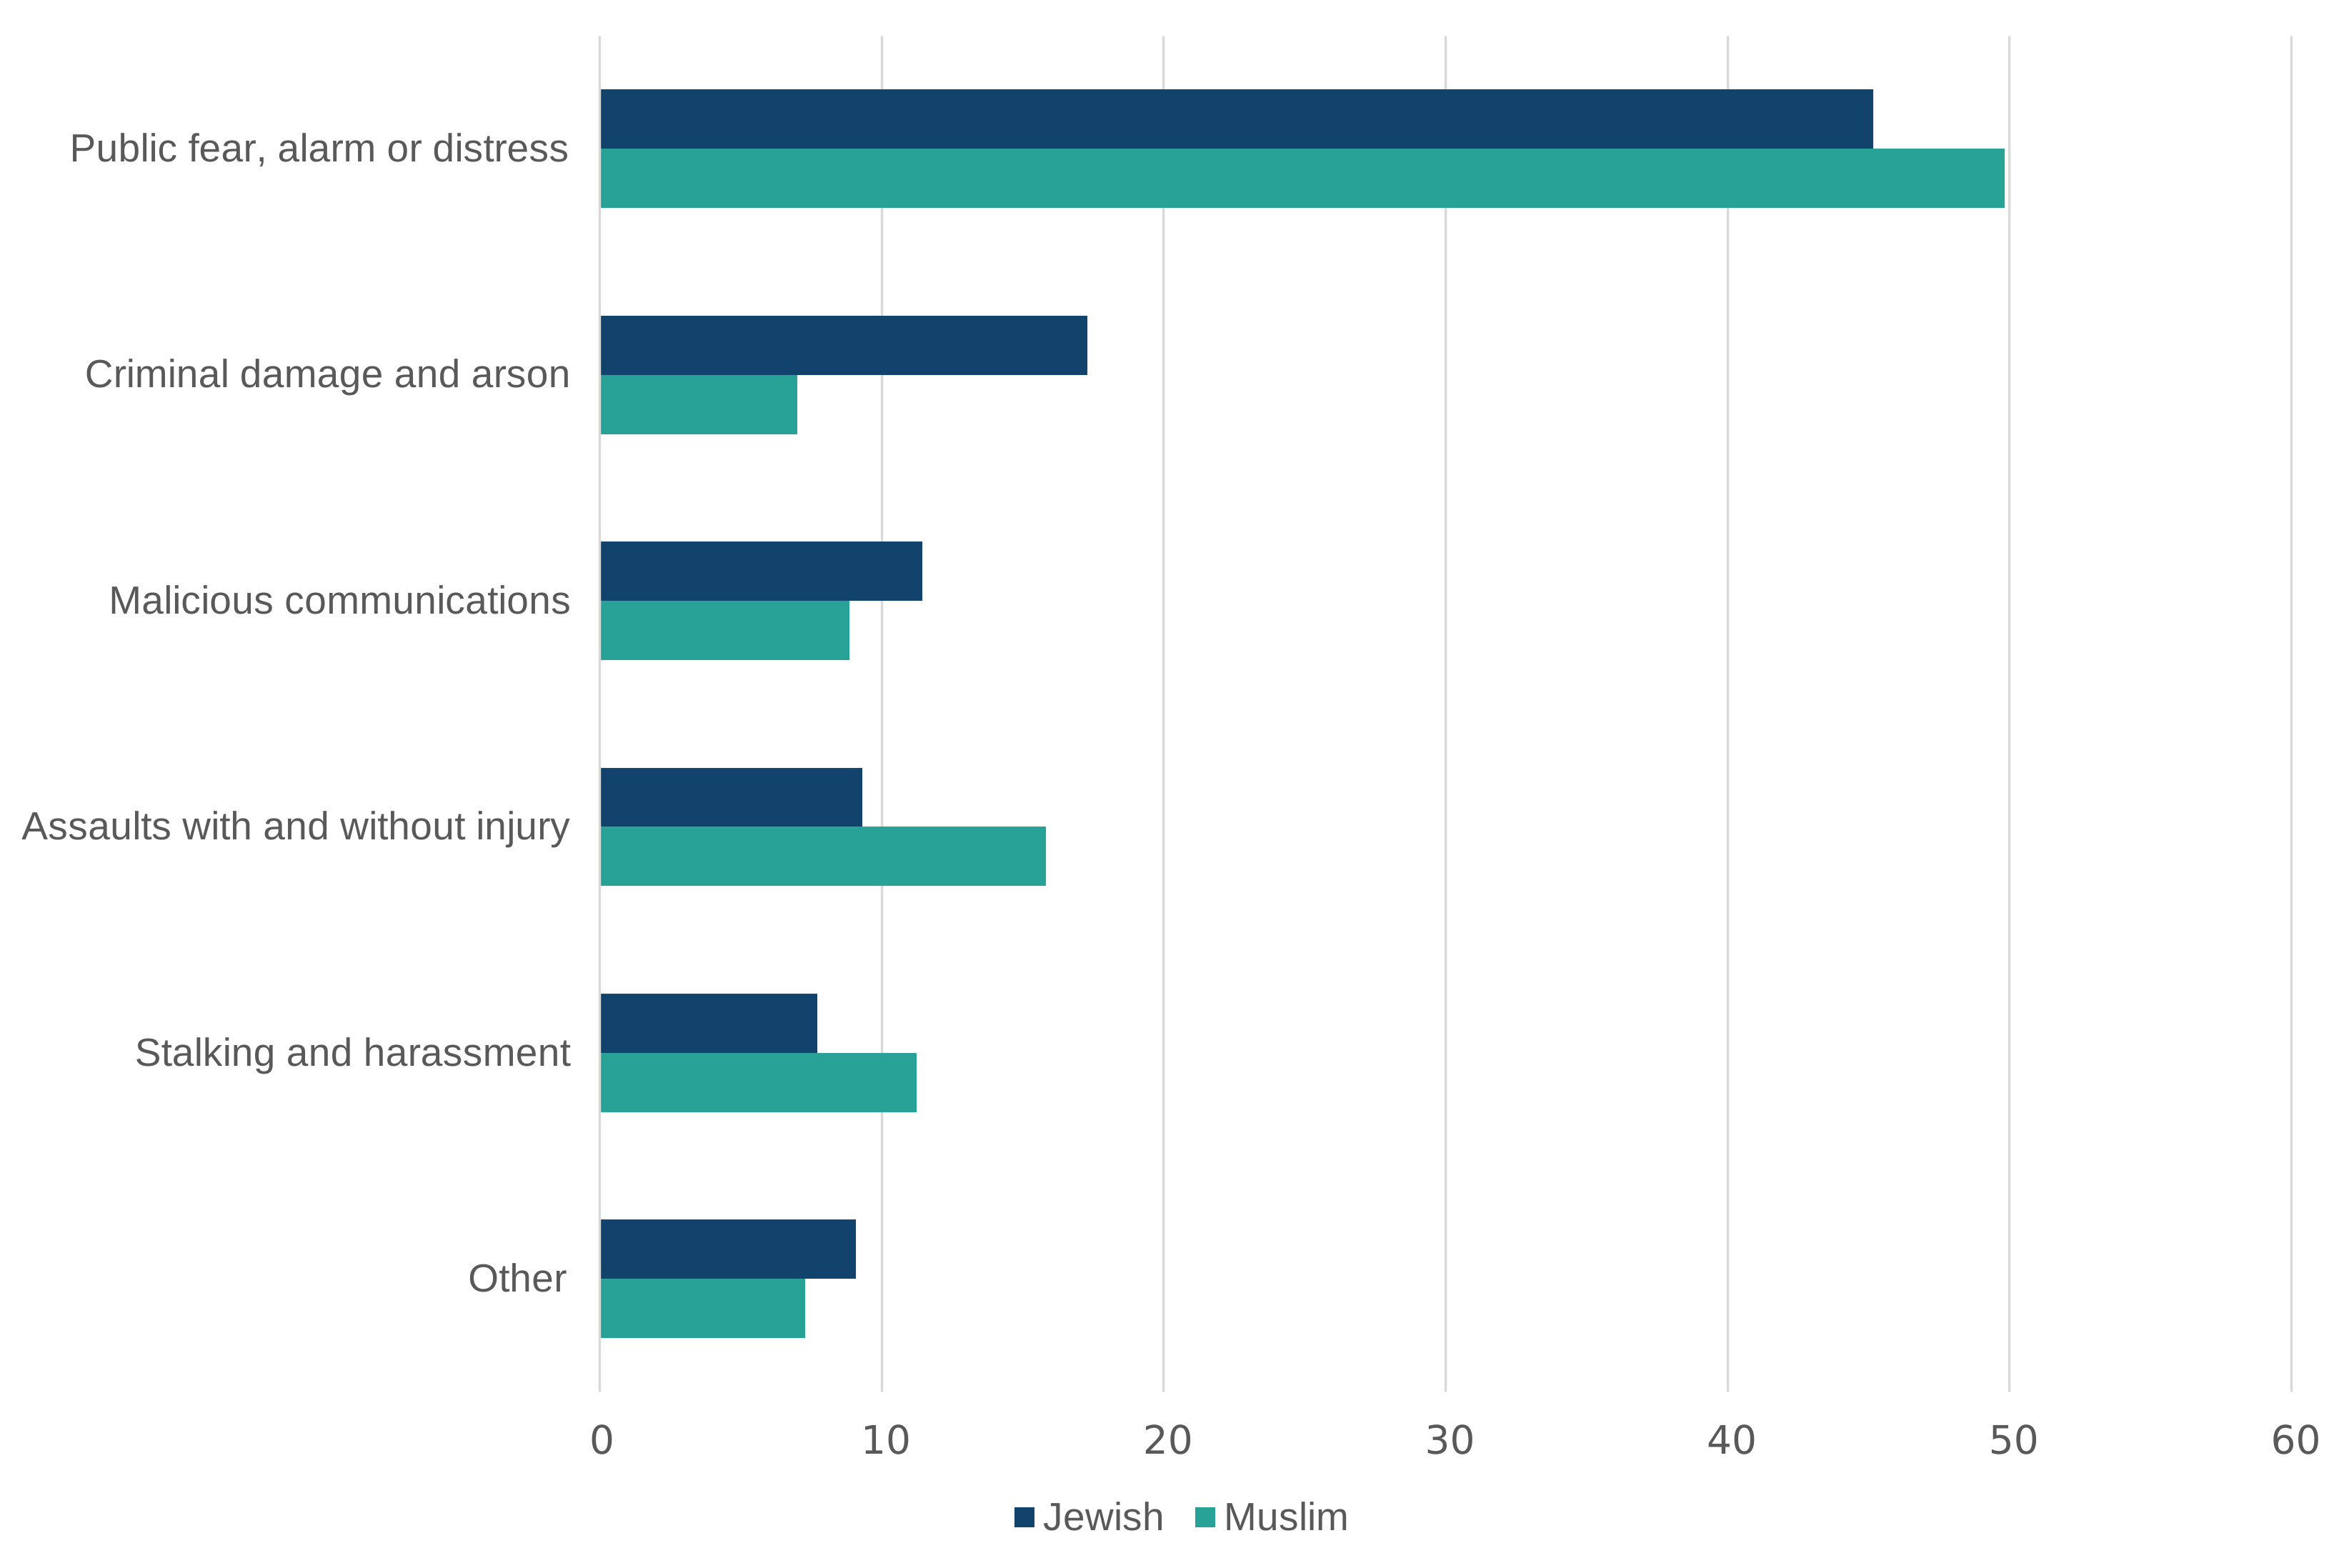
As in previous years, public order offences were the most commonly recorded hate crimes targeted against Muslims and Jews, specifically public fear, alarm or distress offences.
Figure 2.4 Proportion of offences targeted against Jews and Muslims, by offence type, year ending March 2026
Source: Police recorded crime, Home Office
Of the 11,419 religious hate crimes recorded by the police in the year ending March 2026, information on the targeted religion was provided in 11,142 of the offences (98%). However, in 12% of these cases, the religion was recorded by the police as ‘unknown’. Information on the targeted religions for the year ending March 2026 can be found in Table 2.2.
Table 2.2: Number, proportion and rates of religious hate crimes recorded by the police, by the perceived targeted religion, all forces, year ending March 2025 and year ending March 2026
Perceived religion of the victim | 2024/25 | 2025/26 | Proportion of religious hate crimes 2025/26 (%) |
Religious hate crimes rate per 10,000 population 2025/26 | % change |
|---|---|---|---|---|---|
| Buddhist | 28 | 62 | 1 | 2 | [x] |
| Christian | 502 | 624 | 6 | 0 | 24 |
| Hindu | 182 | 210 | 2 | 2 | 15 |
| Jewish | 2,874 | 3,162 | 28 | 117 | 10 |
| Muslim | 4,479 | 5,132 | 46 | 13 | 15 |
| Sikh | 259 | 267 | 2 | 5 | 3 |
| Other | 612 | 514 | 5 | 15 | -16 |
| No religion | 161 | 217 | 2 | 0 | 35 |
| Unknown | 1,075 | 1,309 | 12 | [u] | 22 |
| Total number of targeted religions | 10,172 | 11,497 | |||
| Total number of religious hate crimes (targeted religion provided) | 9,843 | 11,142 | |||
| Number of offences where no information on targeted religion was provided | 224 | 277 | |||
| Total number of religious hate crime offences | 10,067 | 11,419 | 13 |
Source: Police recorded crime, Home Office
Notes:
- [u] indicates a number is unavailable.
- [x]indicates the percentage change is not reported because the base number of offences is less than 50.
Information on religious hate crimes can also be presented based on rates per resident population, using estimates from the 2021 Census. In the last year, there were 117 police recorded religious hate crimes targeted at Jewish people per 10,000 population, the highest rate for any religious group. The next highest rate was for religious hate crimes targeted at Muslims, with 13 per 10,000 population.
Information published from the Crime Survey of England and Wales (CSEW) from the combined surveys for the year ending March 2023 to the year ending March 2025 also provides information on who has experienced hate crime. These figures, published in 2025, estimated that 0.8% of Muslims experienced a religious hate crime per year on average, compared with 0.4% of Jewish people. The different pattern between the 2 data sources may be due to the likelihood of a crime being reported to the police and the different coverage between the sources. For example, the CSEW does not cover public order offences, and these comprise over half (53%) of police recorded hate crimes. Furthermore, the CSEW provides information on whether a victim has experienced at least one crime in the year to interview; in the police recorded crime data, one victim may have reported multiple crimes. Other differences between the 2 sources are given in section 4.4.
Sexual orientation hate crime
There were 21,407 sexual orientation hate crimes recorded by the police in the year ending March 2026, a 1% fall compared with the previous year (21,527 offences). Excluding the MPS, these offences have fallen by 17% since the year ending March 2022, from 22,317 to 18,520 offences. The decline in these offences has been, in part, due to a reduction in malicious communication offences. This follows changes made to the Home Office Counting Rules (HOCR) in 2023 for conduct crimes (stalking, harassment and coercive and controlling behaviour). The requirement to record 2 crimes when one of them was a conduct crime was removed, leading to a reduction in those crimes often associated with conduct crimes, such as malicious communications. There has been an increase in stalking and harassment offences in recent years as the police focus their investigations on these conduct crimes.
Disability hate crime
Disability hate crimes fell by 5% over the last year, to 10,140 offences. Excluding the MPS, this was the third consecutive annual fall in these offences (from 13,637 in the year ending March 2023 to 9,616 in the latest year; down 29%). Over the last year, there were falls in hate-related harassment (down 209), malicious communications (down 141) and assault (with and without injury; down 125) offences.
Transgender hate crime
Transgender hate crimes fell by 4% over the last year, to 3,955 offences. Excluding the MPS, this was the third consecutive annual fall in these offences (from 4,477 in the year ending March 2023 to 3,643 in the latest year, down 19%). There were falls in hate-related harassment (down 100), malicious communication offences (down 59) and assault (with and without injury; down 62) offences in the last year.
Hate crime by multiple factors
It is possible for a crime to have more than one motivating factor (for example an offence may be motivated by hostility towards both the victim’s race and religion). Thus, as well as recording the overall number of hate crimes, the police also collect data on the number of motivating factors by strand as shown in Table 2.1. For this reason, the sum of the 5 motivating factors in the above exceeds the 146,825 overall hate crime offences recorded by the police. Of the hate crime offences recorded in the year ending March 2026, 6% were estimated to have involved more than one motivating factor (based on 38 forces who supplied suitable record level data for this analysis).
Hate crime data by police force area from the year ending March 2012 to the year ending March 2026 can be found in the Home Office Open data tables.
2.3 Hate crimes by type of offence
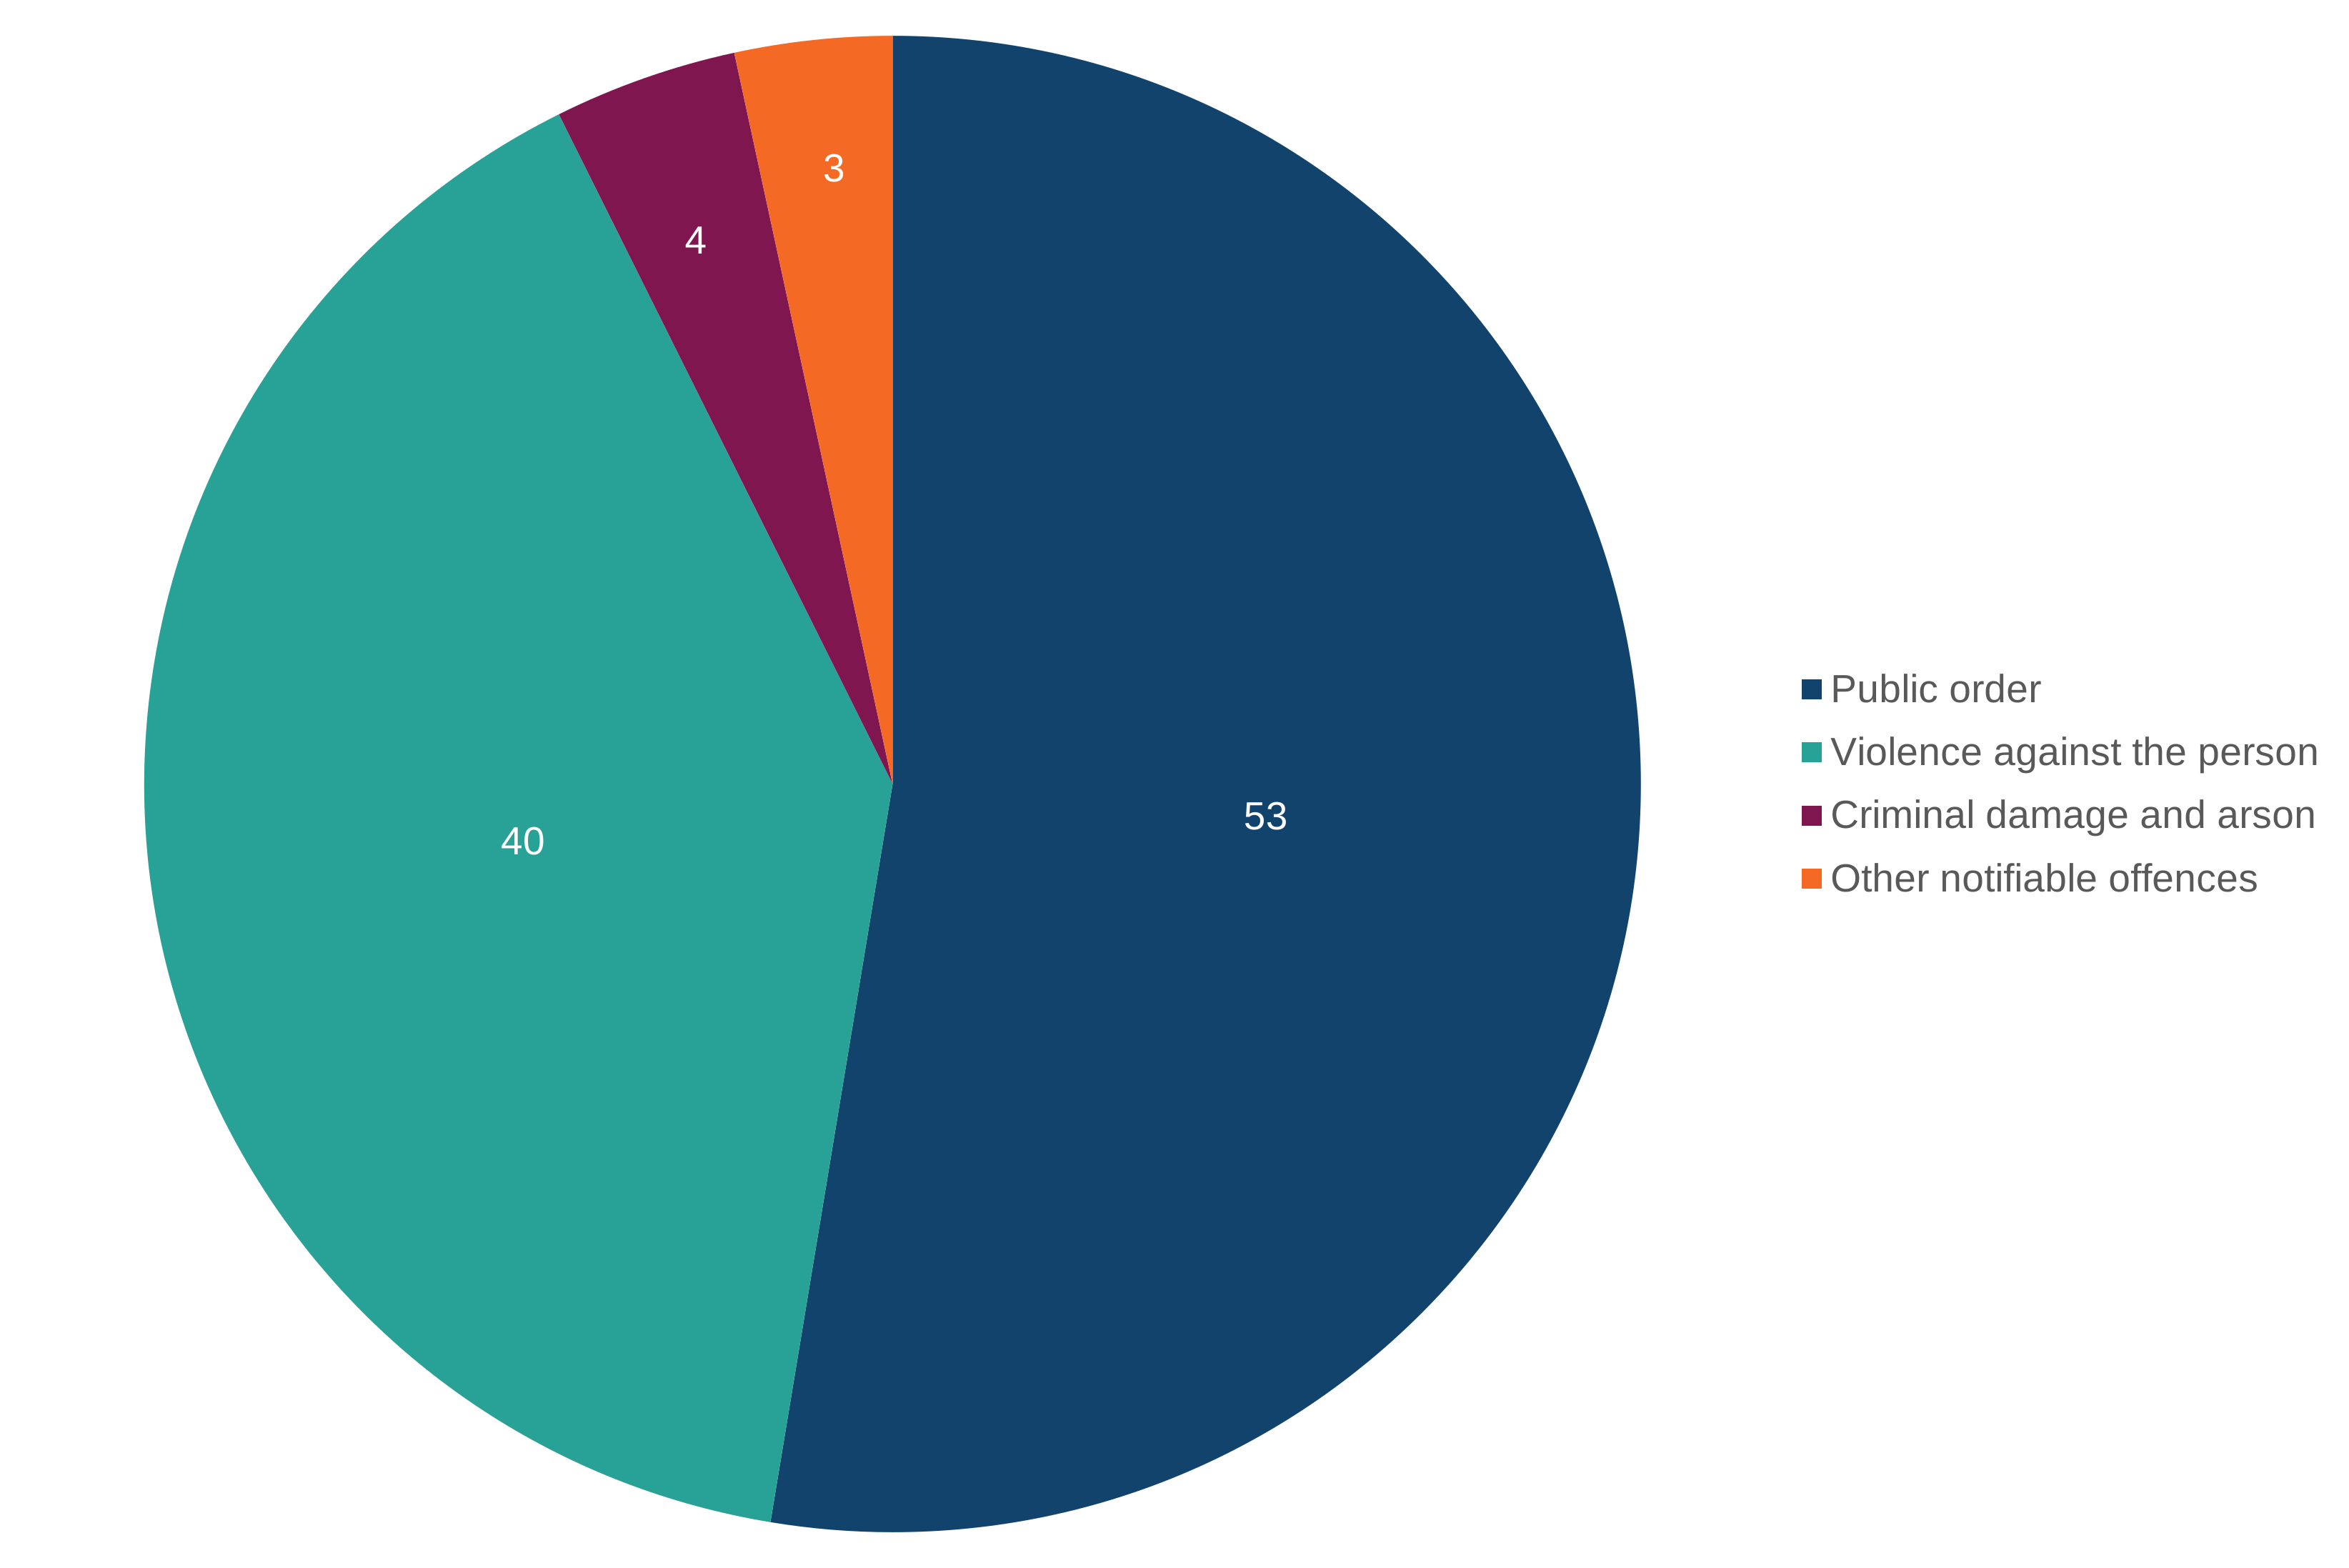
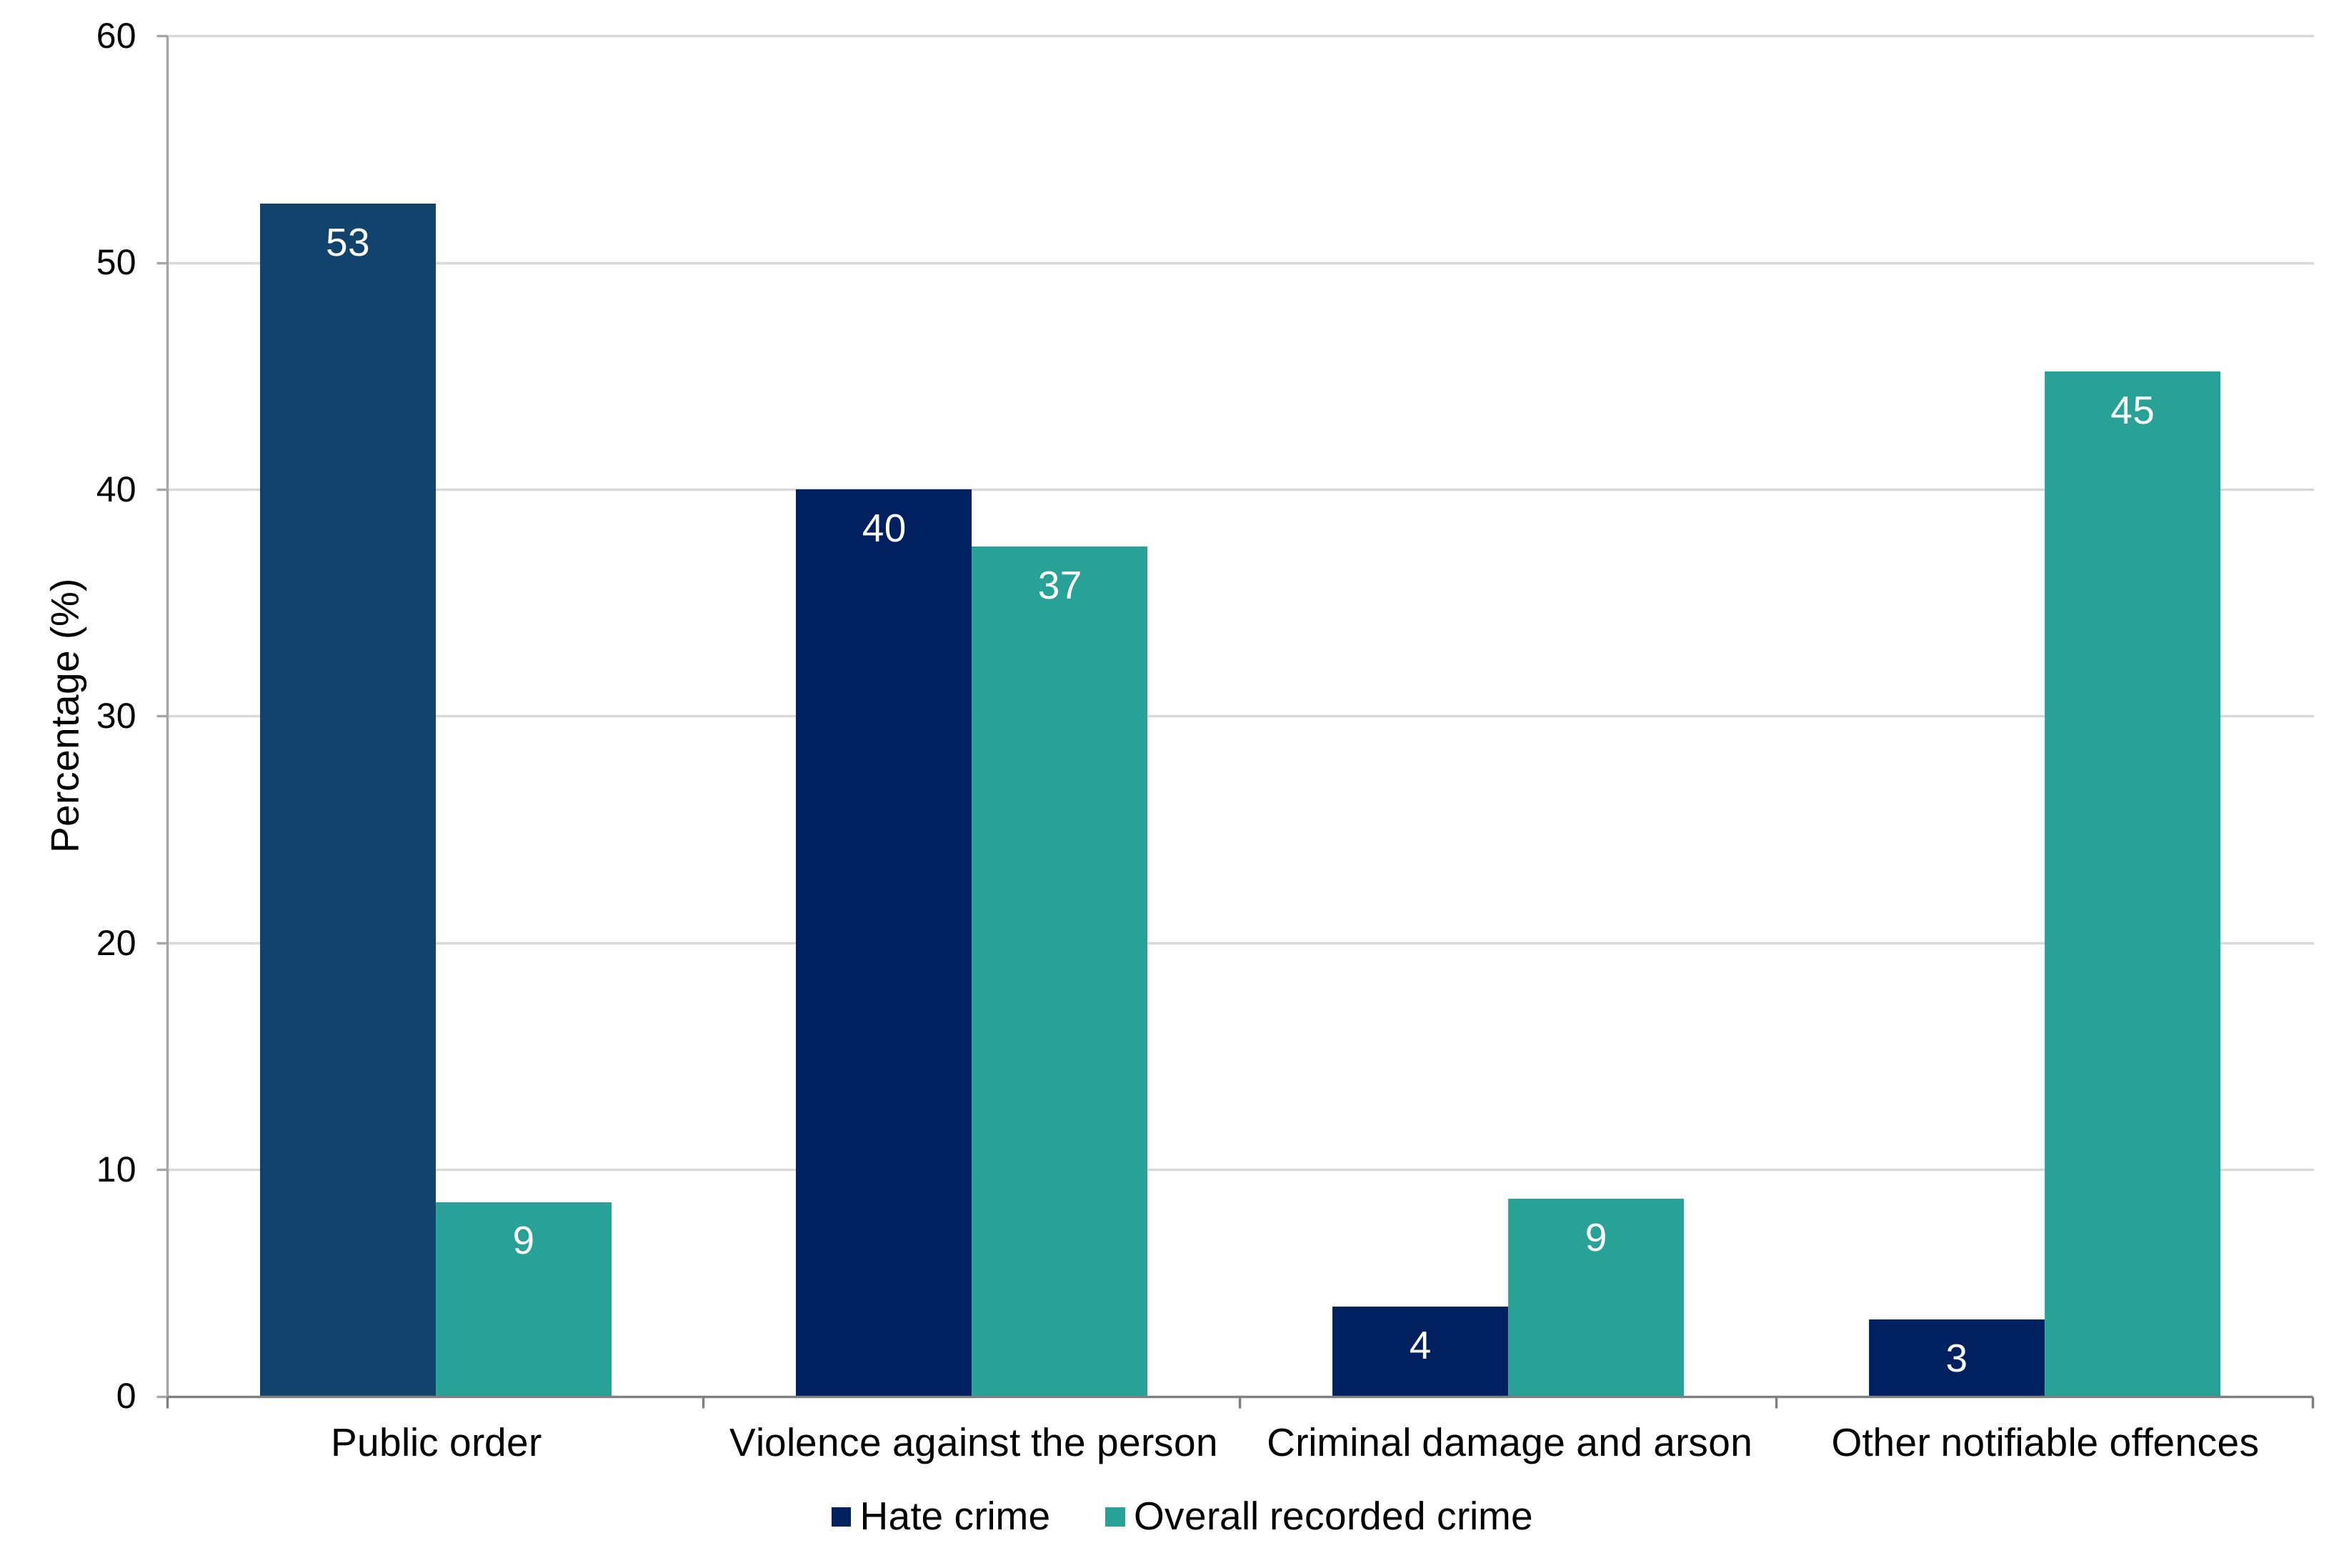
As in previous years, just over half (53%) of the hate crimes recorded by the police were for public order offences, with a further 40% for violence against the person offences (Figure 2.5; Hate crime, England and Wales, year ending March 2026: data tables; Table 6. Together, these offence categories accounted for over 9 in 10 (93%) of all hate crimes recorded by the police in England and Wales.
Figure 2.5: Distribution of offences recorded by the police flagged as hate crimes, England and Wales, year ending March 2026
Source: Police recorded crime, Home Office
The distribution of hate crime offences differs markedly from all police recorded crime. Theft offences accounted for almost a third (31%) of all recorded crime in the year ending March 2026 (for information on offences for all police recorded crime see: Crime in England and Wales); these offences would be less likely to involve a motivating factor against a monitored hate crime strand. In contrast, public order offences accounted for 9% of all notifiable offences compared with 53% of hate crime offences (Figure 2.6).
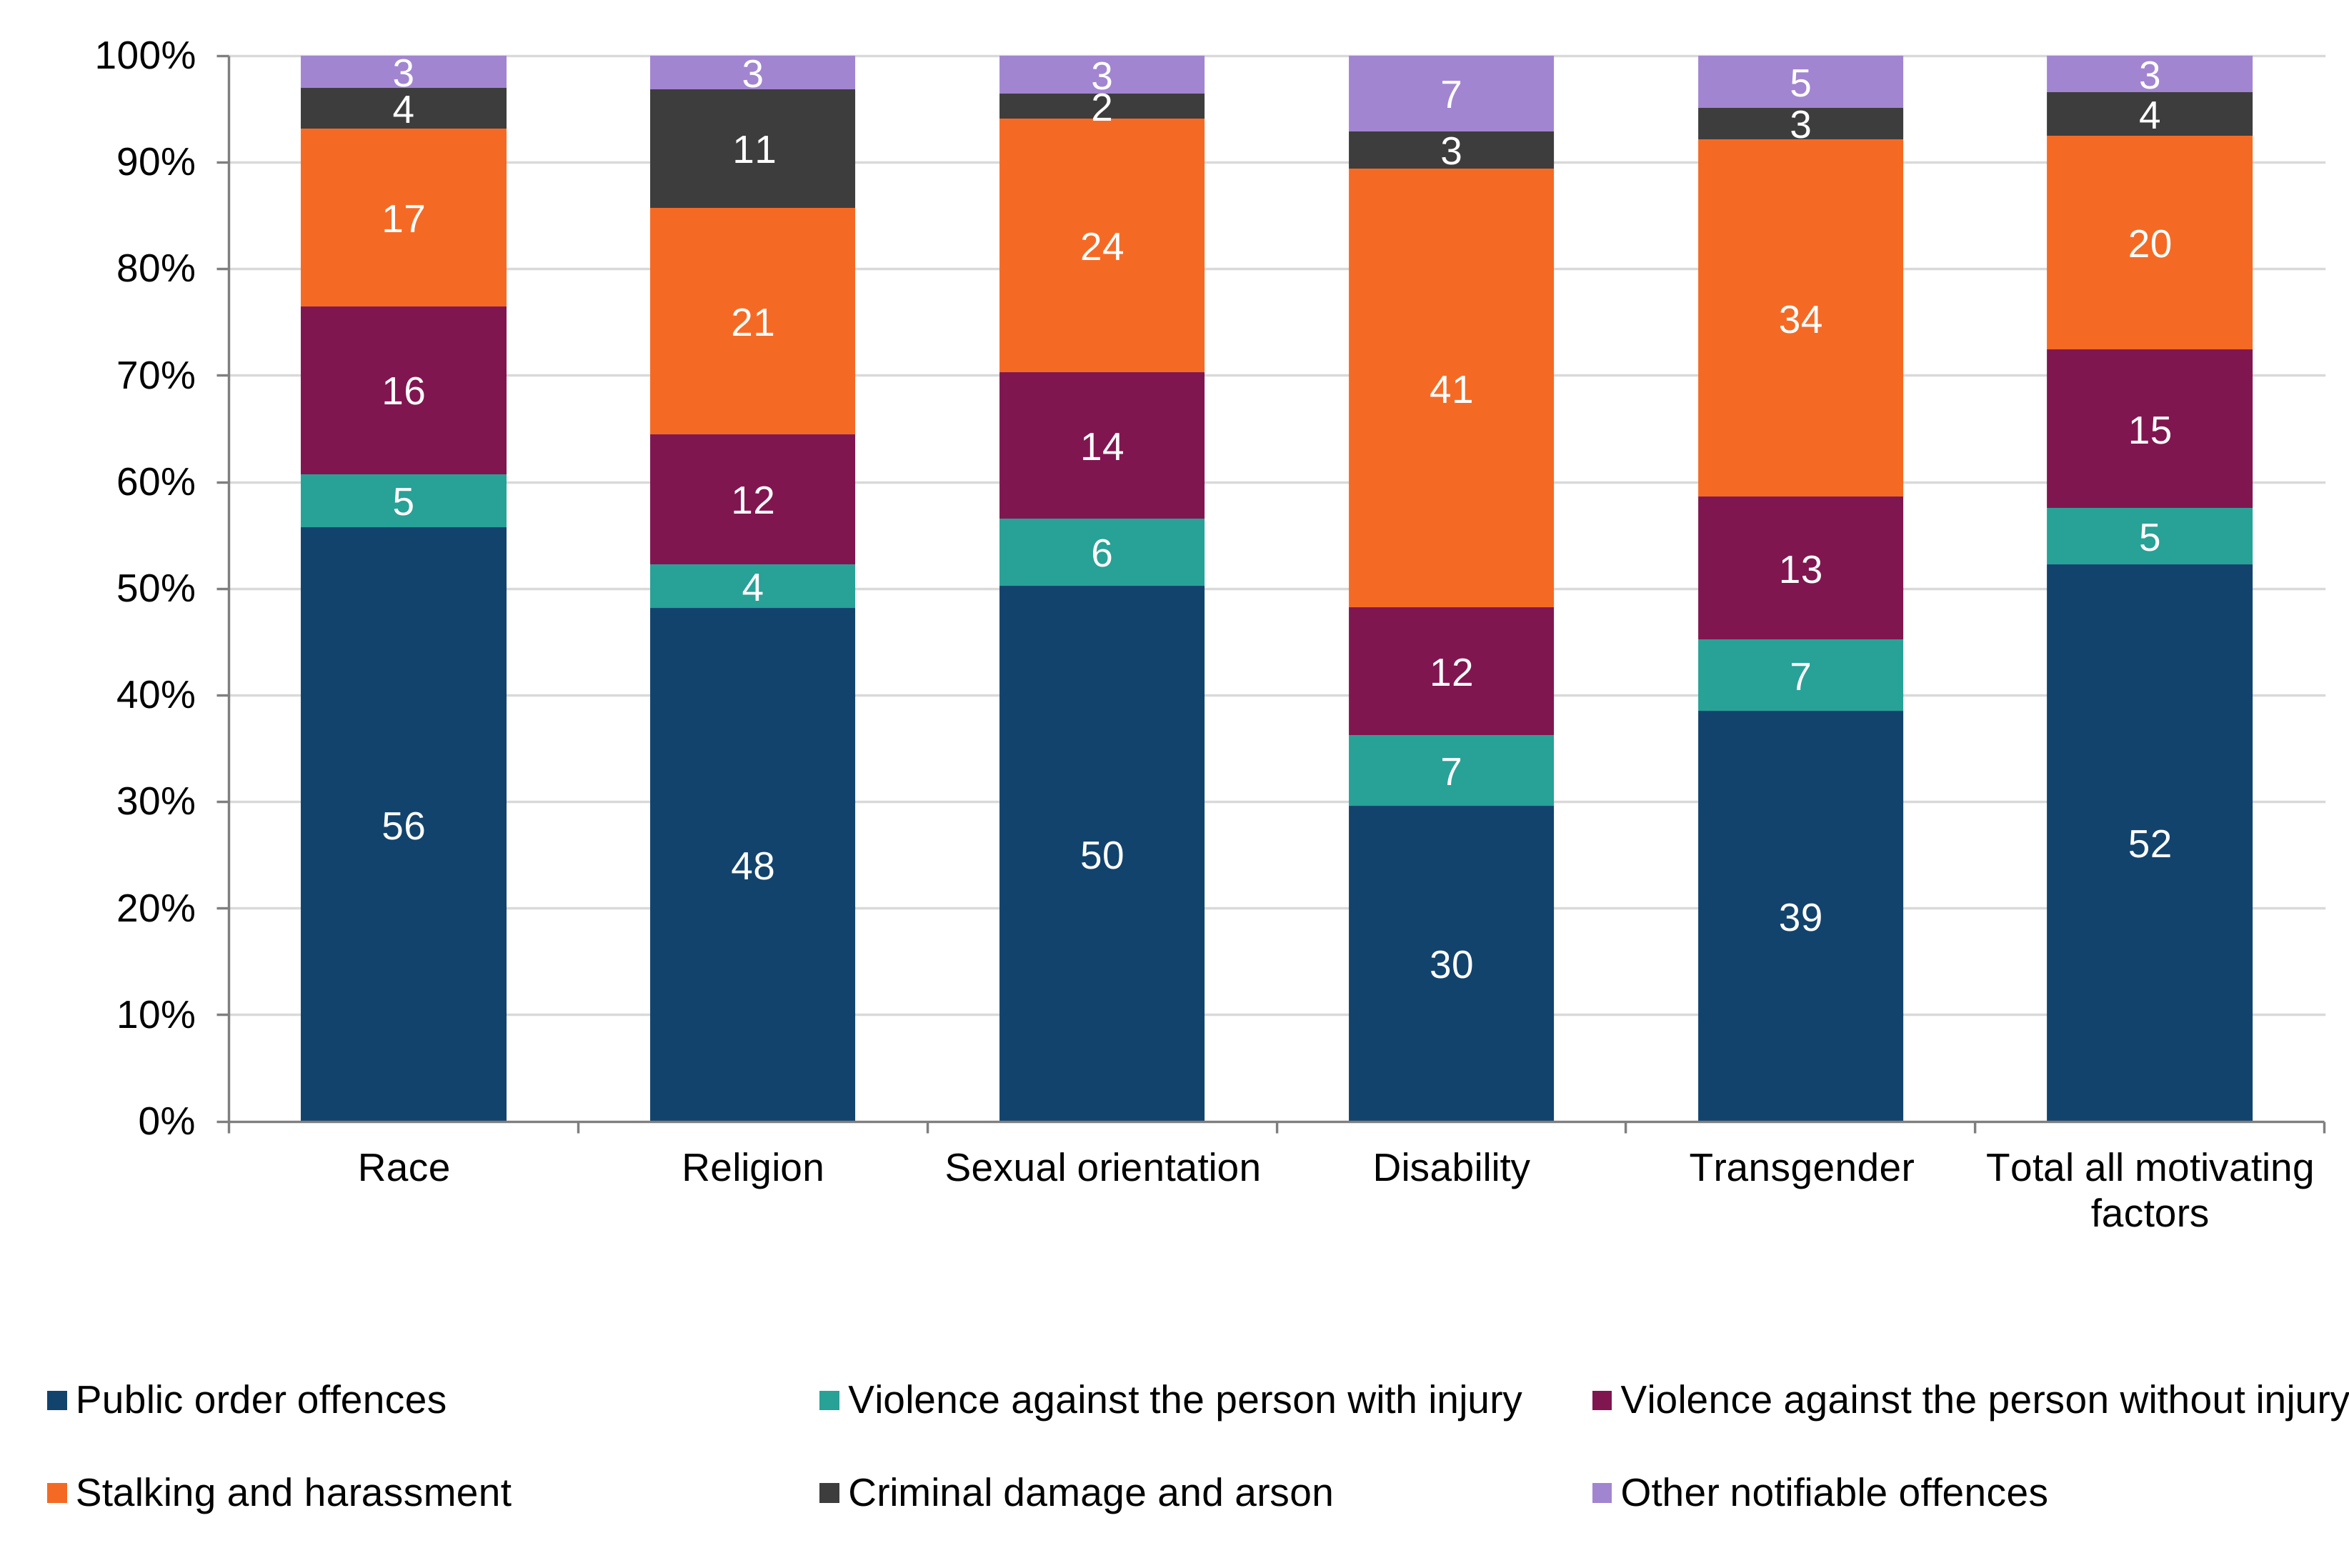
Figure 2.6 shows what type of offences were recorded for each monitored strand. As in previous years, public order offences were the most common category to be recorded for all strands except for disability-targeted hate crime. Stalking and harassment offences were the most commonly recorded for disability-targeted hate crimes.
Figure 2.6: Breakdown of hate crimes and overall recorded crime by selected offence types, England and Wales, year ending March 2026
Source: Police recorded crime, Home Office
Figure 2.7 shows what type of offences were recorded for each monitored strand. As in previous years, public order offences were the most common category to be recorded for all strands except for disability-targeted hate crime, where stalking and harassment offences were the most commonly recorded.
Figure 2.7: Breakdown of hate crime by selected offence types and monitored strand, England and Wales, year ending March 2026
Source: Police recorded crime, Home Office
2.4 Racial or religiously aggravated offences
The data the Home Office receives in the main police recorded crime return for racially or religiously aggravated offences is available on a monthly basis whereas data for all hate crimes for all forces is only available annually.
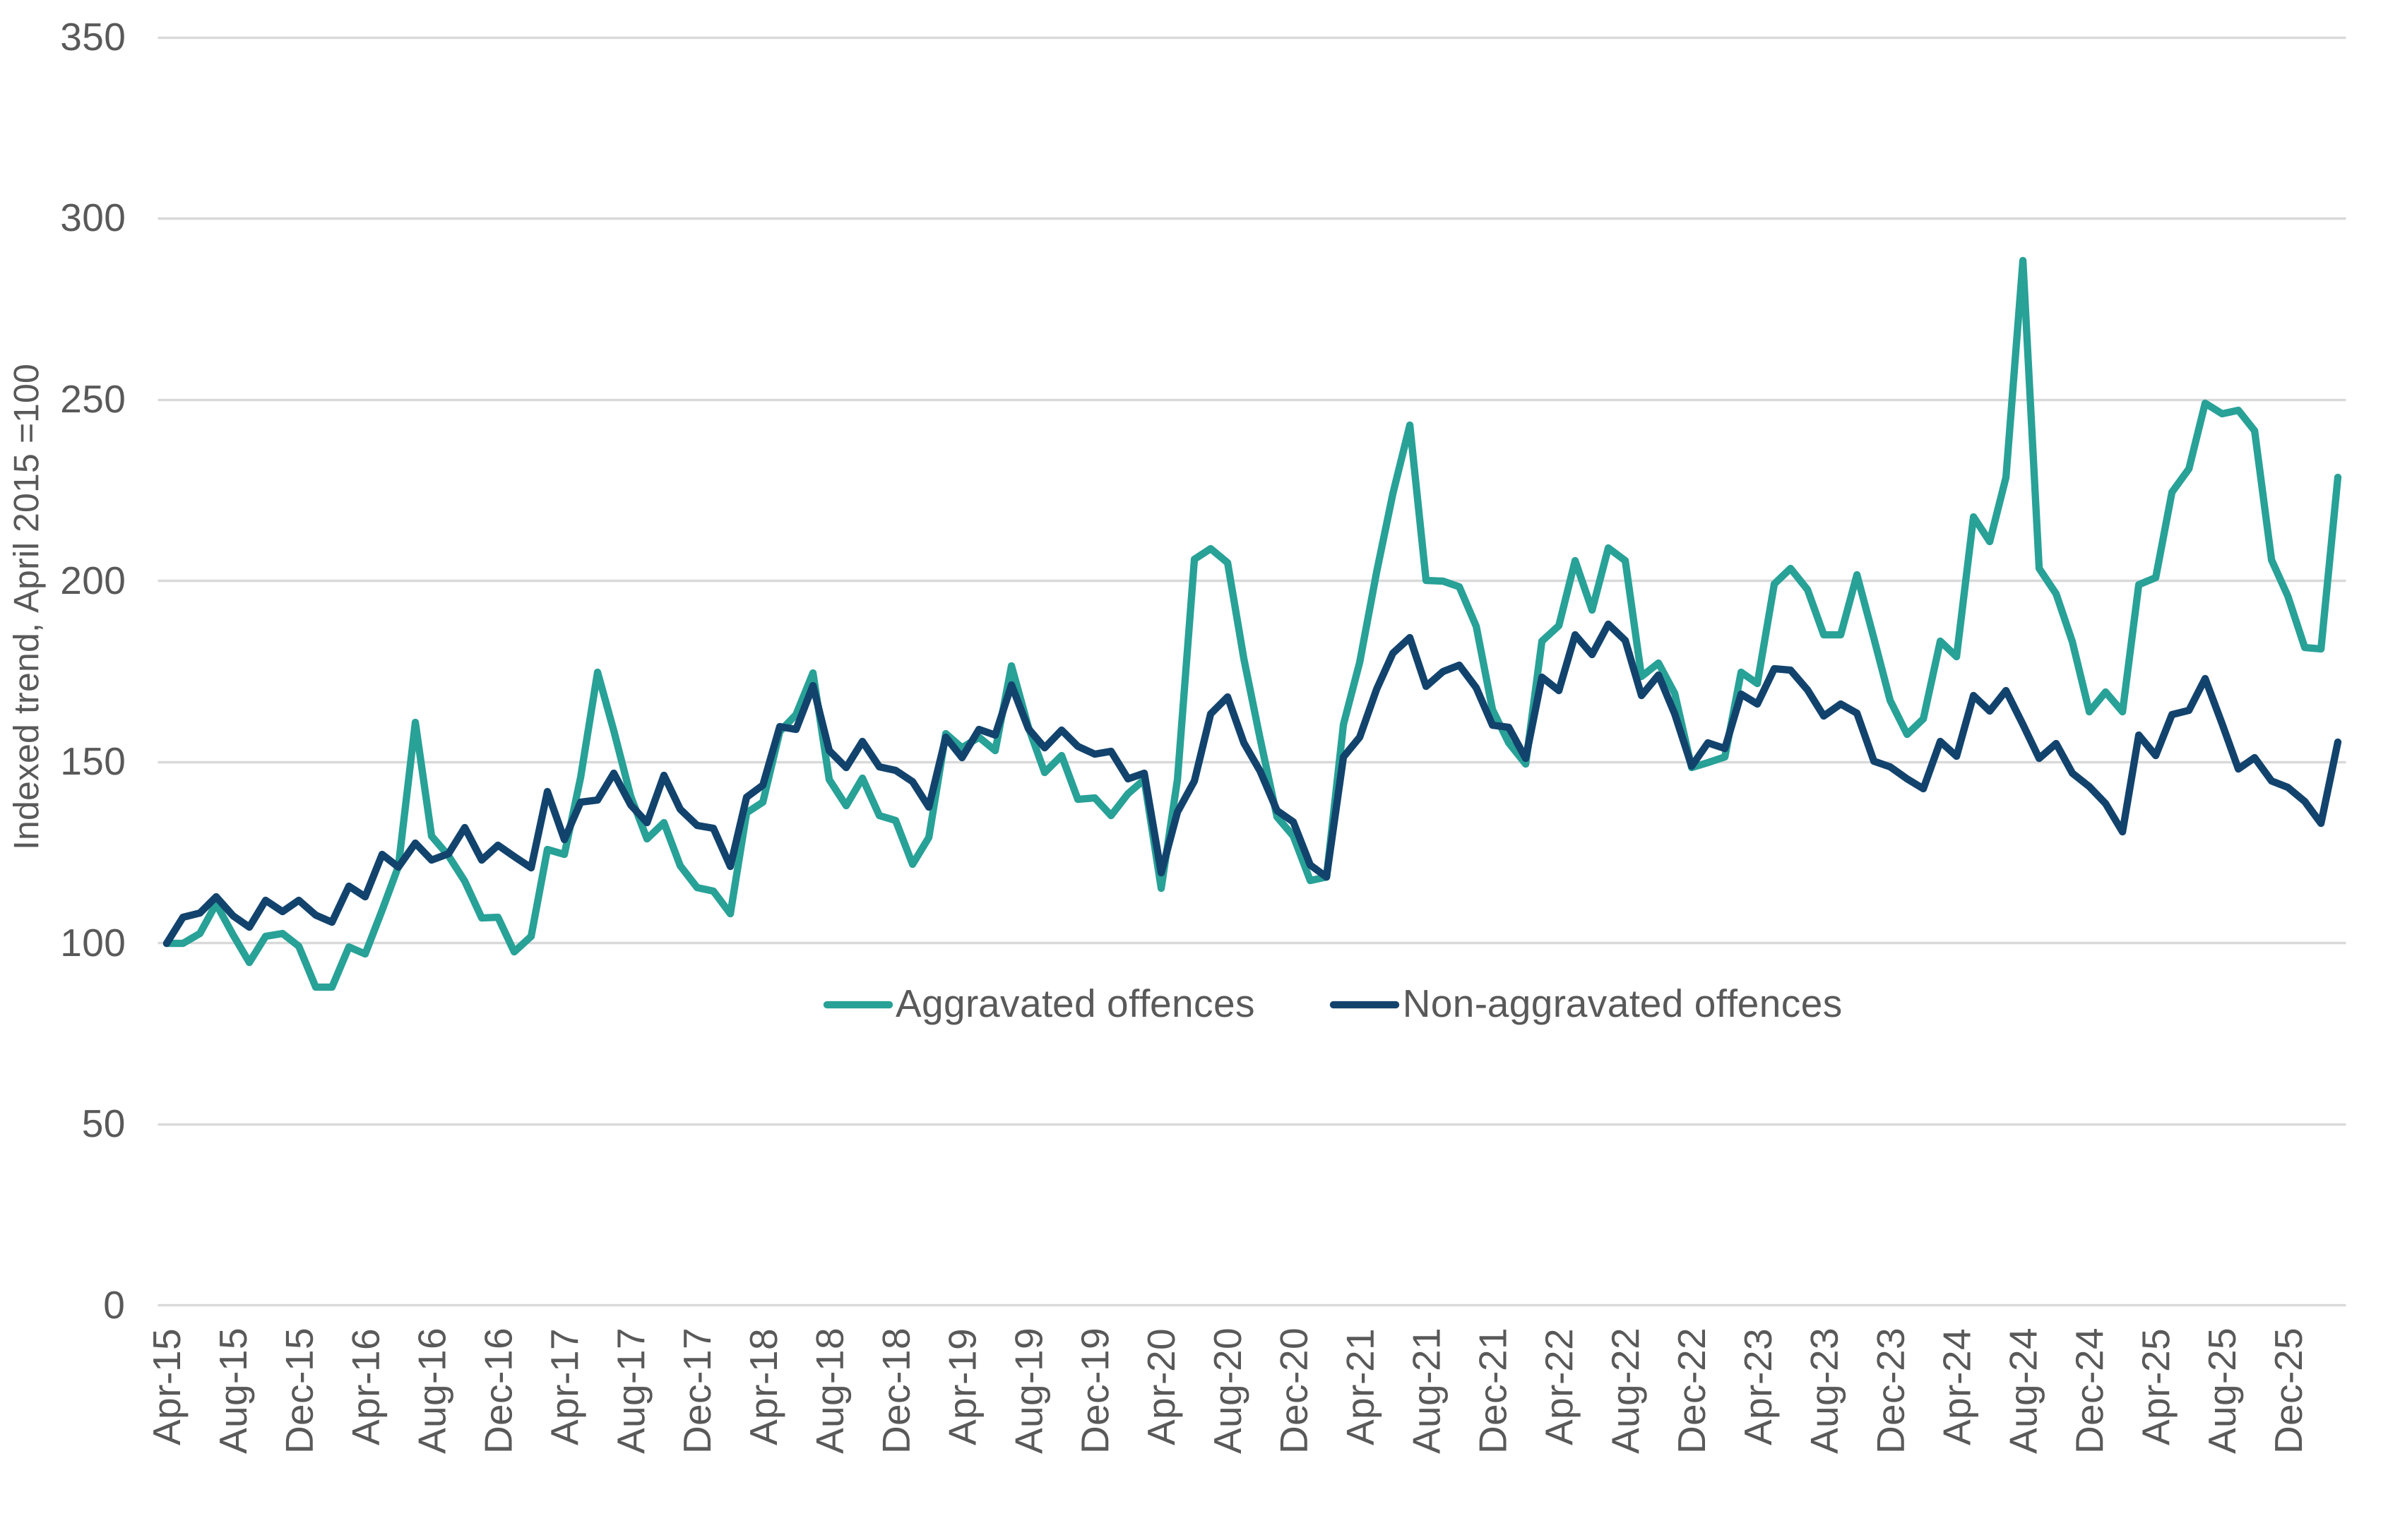
There are several time periods where a rise in aggravated offences has not been seen in the non-aggravated offences. These ‘spikes’ coincided with certain events. In the last year, there were elevated levels of these aggravated offences from May to October 2025, which coincided with an increased number of protests and incidents of public disorder. There was also a spike in March 2026, following the beginning of the USA-Iran conflict on the 28 February. The largest spike was seen in August 2024, following the Southport murders on the 29 July and the subsequent disorder and related protests in certain towns and cities across England. There were 10,158 racially or religiously aggravated offences recorded in August 2024, the highest monthly total ever recorded.
Previous spikes in racially or religiously aggravated offences were also observed:
- following the start of the Israel-Hamas conflict in October 2023
- at times when there have been an increased number of protests, such as the summer of 2020 following the Black Lives Matter protests and far-right counter-protests following the death of George Floyd on 25 May in the United States of America
- July 2017, following the terrorist attacks seen that year
- around the time of the EU Referendum
Prior to the year ending 2023, the trends in the aggravated and non-aggravated offences were similar – the trends would converge after the spikes. Since April 2023, there has been a gradual widening between the 2 trend lines, which is likely to reflect the increased level of protests and incidents of public disorder over this time period.
Figure 2.8: Indexed number of racially or religiously aggravated offences recorded by the police by month, England and Wales, April 2015 to March 2026
Source: Police recorded crime, Home Office
Ethnicity of victims in racially or religiously aggravated crimes
From April 2021, it became a requirement for forces to provide the Home Office with data on the ethnicity of victims of racially or religiously aggravated offences.
Of the 92,725 racially or religiously aggravated crimes recorded by the police in the year ending March 2026, information on the victim ethnicity was provided in 43,395 of the offences (47%). In some offences, the police may not have asked the victim for their ethnicity, the victim might not have wanted to provide it, or there might not have been an identifiable victim (for public order offences, for example). Data was supplied by all forces except Cheshire and Gloucestershire Police, although data completeness varied by force.
Where the ethnicity of the victim was known, the victim identified as Asian in around a third of offences (34%). A further 29% identified as White and 24% identified as Black (Table 2.3). It is likely that offences against White victims will include xenophobic abuse against people not born in the UK.
Given the relatively high proportion of offences where the ethnicity of victim was not recorded, these figures may not provide a representative picture across England and Wales and should be taken as indicative only.
Table 2.3: Proportion of racially or religiously aggravated offences recorded by the police, by victim ethnicity (where known), year ending March 2026, England and Wales (42 Forces)
| Ethnicity | ||||||
|---|---|---|---|---|---|---|
| Offence Code | Description | White (%) | Black/ African/ Caribbean/ Black British (%) | Asian/ Asian British (%) | Mixed/multiple ethnic groups (%) | Other ethnic group (%) |
| 105B | Racially or religiously aggravated assault without injury | 21 | 31 | 35 | 7 | 6 |
| 58J | Racially or religiously aggravated criminal damage | 40 | 16 | 31 | 6 | 7 |
| 8M | Racially or religiously aggravated harassment | 35 | 21 | 28 | 11 | 6 |
| 8P | Racially or religiously aggravated assault with injury | 25 | 27 | 33 | 9 | 6 |
| 9B | Racially or religiously aggravated public fear, alarm or distress | 30 | 22 | 35 | 8 | 5 |
| Total offences (%) | 29 | 24 | 34 | 8 | 5 |
Source: Police recorded crime, Home Office Data Hub
2.5 Hate crime outcomes
The Home Office collects information on the investigative outcomes of police recorded offences, including those that are identified as hate crimes. For further information on outcomes see Crime Outcomes in England and Wales: 2025 to 2026.
This section covers how the police have dealt with hate crimes recorded in the year ending March 2026. This analysis is based on the outcomes assigned to crimes recorded at the time the data was extracted (July 2026). Some offences will not have been assigned an outcome at this time and therefore these figures will be subject to change as police investigations continue and more outcomes are assigned.
Racially or religiously aggravated offence outcomes
Data presented in this section is for racially or religiously aggravated offences. This data was available for all police forces. Data on outcomes for all hate crime offences, which was available for 38 of the 44 police forces, is presented in the next section.
At the time this data was extracted, 90% of racially or religiously aggravated offences had been assigned an outcome compared with 95% of their non-aggravated counterparts (see police recorded crime outcomes open data year ending March 2026).
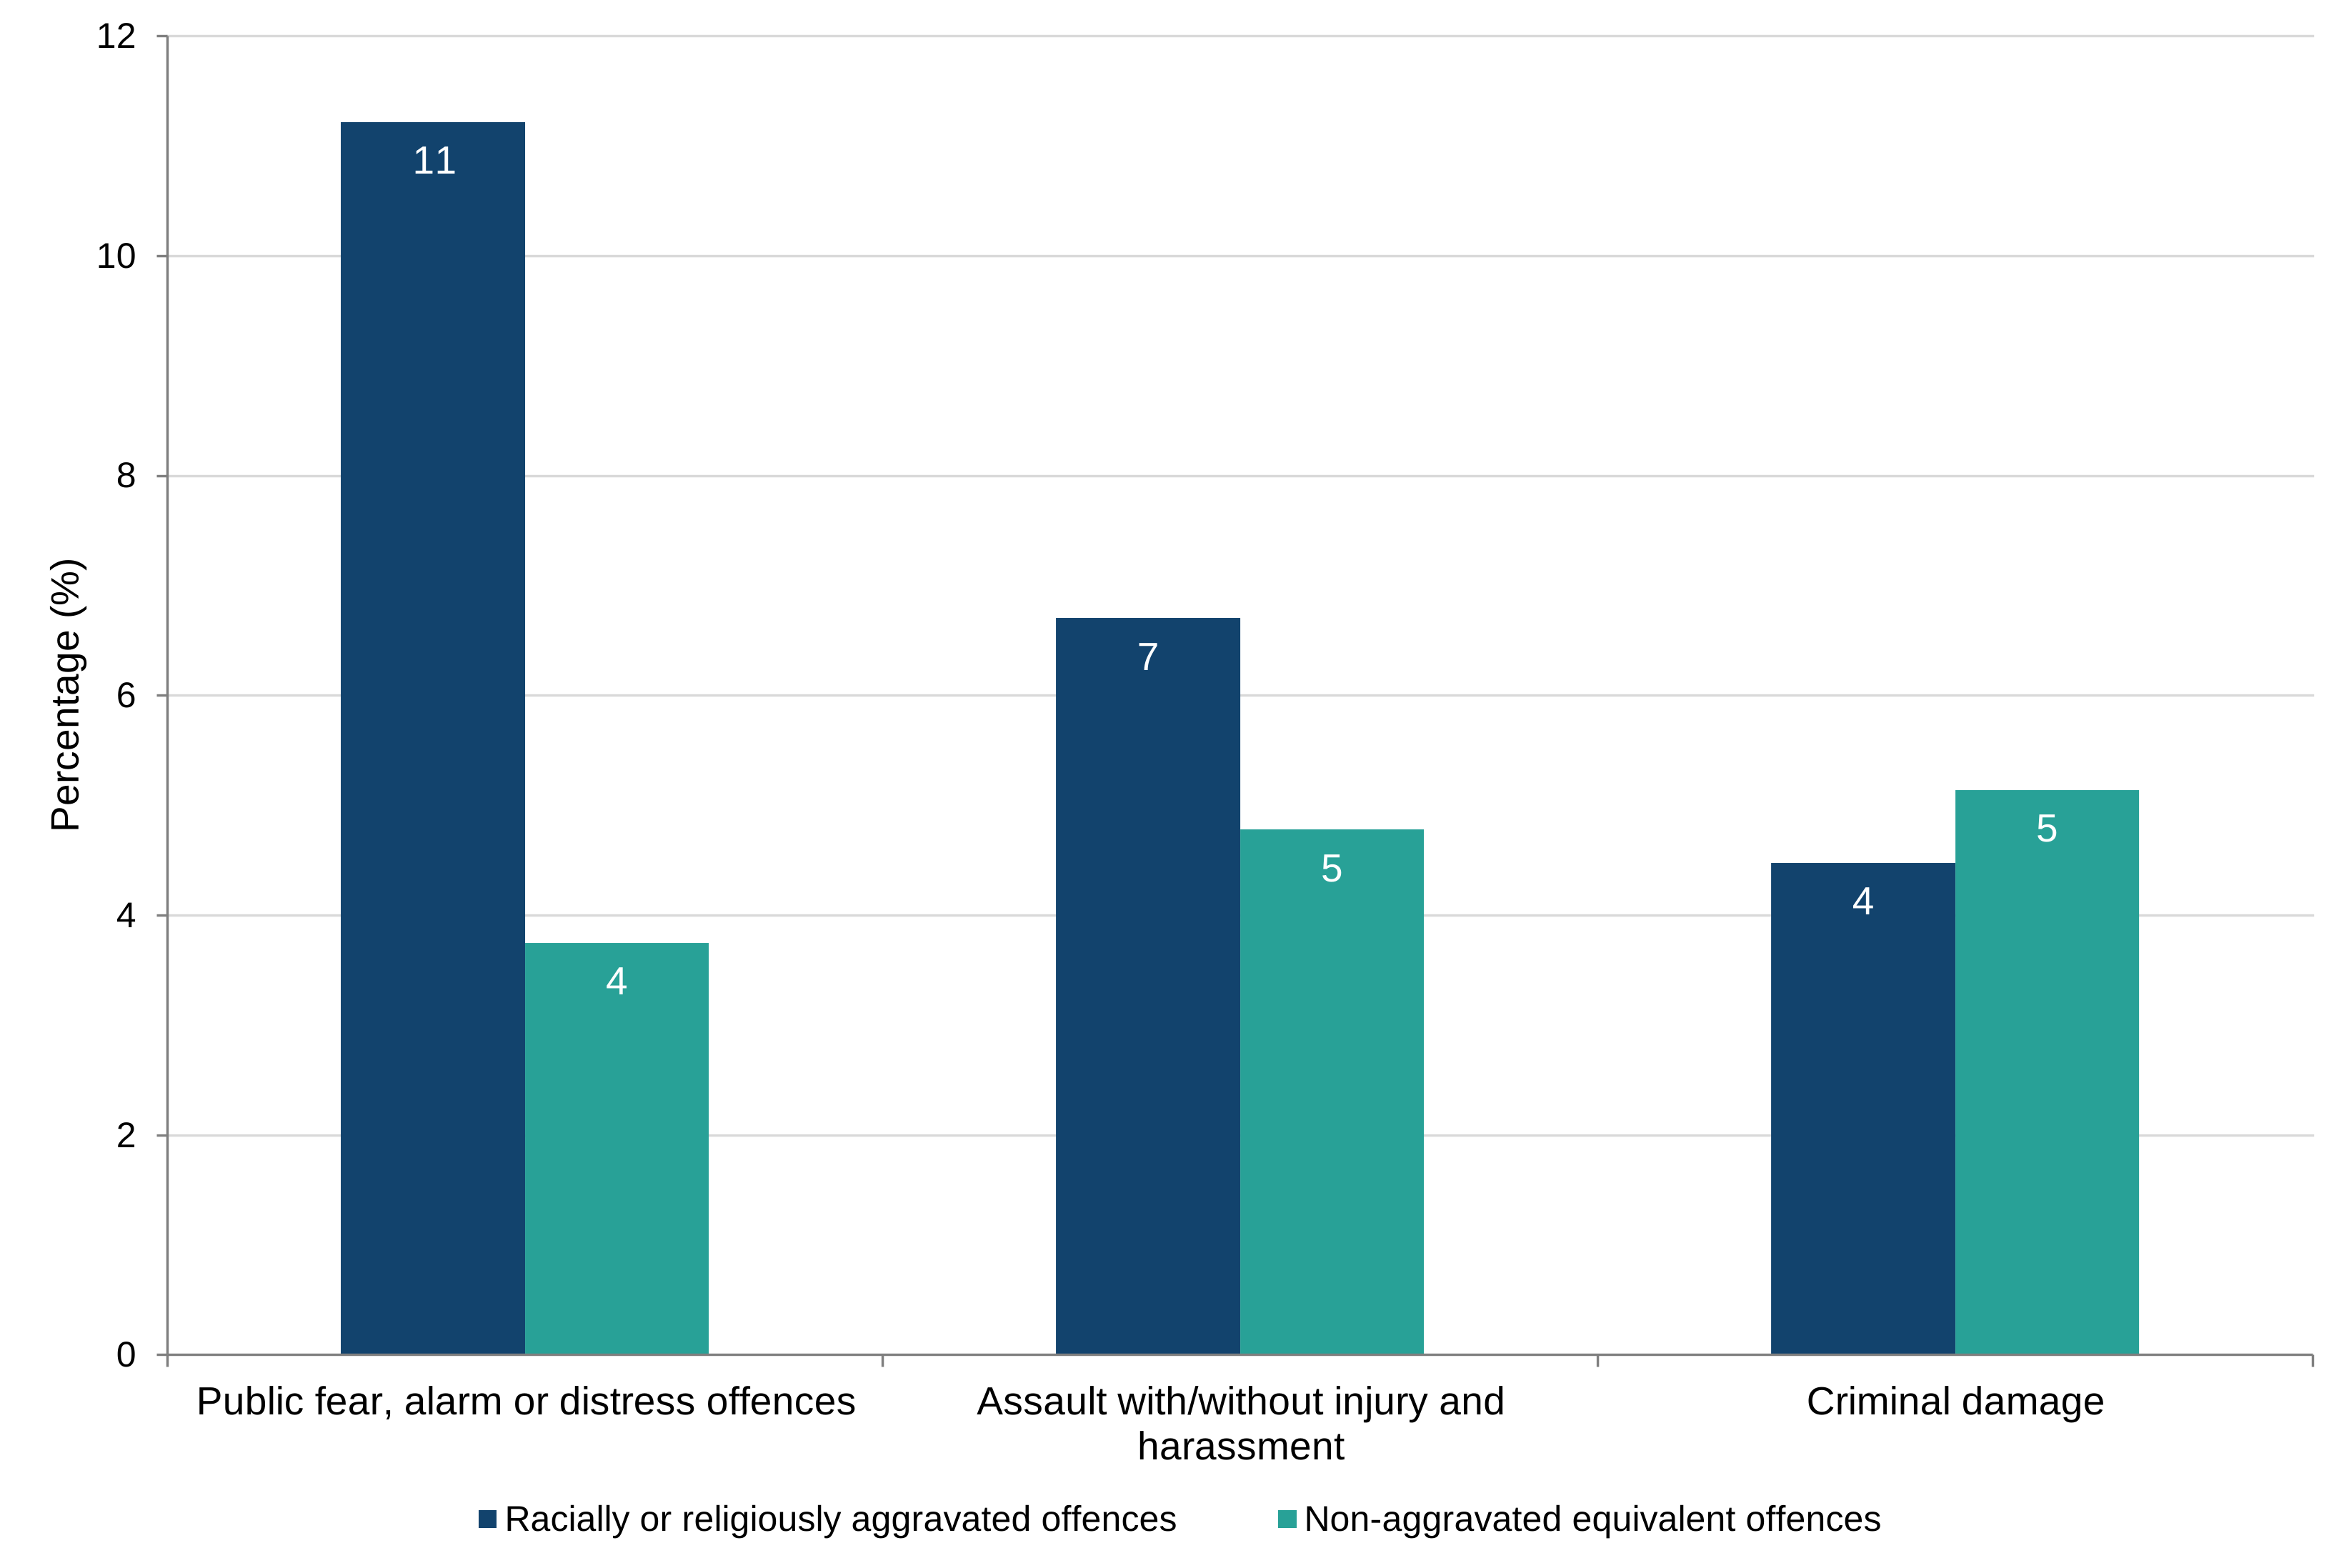
Figure 2.9 shows that racially or religiously aggravated public order and assault offences were more likely to be dealt with by a charge/summons than their non-aggravated counterparts, reflecting the more serious nature of the aggravated offences. For example, nearly 3 times the proportion of racially or religiously aggravated public fear, alarm or distress offences had been dealt with by charge/summons than the non-aggravated equivalent offences (11% and 4% respectively). In contrast, for criminal damage, non-aggravated offences were slightly more likely to result in a charge or summons (5%) compared with the racially aggravated equivalent offences (4%).
Figure 2.9: Percentage of racially or religiously aggravated offences and their non-aggravated equivalents recorded in the year ending March 2026 resulting in charge/summons, by offence type, England and Wales
Source: Police recorded crime, Home Office
Recent years have seen a rise in the overall proportion of racially or religiously aggravated offences resulting in a charge and or summons, up from 8% in year ending March 2024 (at the time the data was published) to 10% in the latest year. This shows a reverse in the long-term downward trend in the proportion of offences resolved by a charge and or summons. For example, in the year ending March 2015, 30% of racially or religiously aggravated public fear, alarm or distress offences were dealt with by charge or summons, compared with 11% in the most recent year. The fall in the charge summons rate was seen across most crime types, in part reflecting improvements in crime recording and the changing caseload and crime mix being dealt with by the police.
Flagged hate crime offences – Home Office Data Hub (HODH)
The Home Office Data Hub (HODH) is a case-level dataset of offences recorded by the police in England and Wales and provides information on how hate crimes have been dealt with by the police. The analyses presented are based on data from 38 of the 44 police forces in England and Wales that supplied adequate data to the Data Hub for such analysis. These forces’ data accounted for 85% of all police recorded hate crime in the year ending March 2026.
In total, 93% of hate crime flagged offences recorded in the year ending March 2026 had been assigned an outcome at the time the data was extracted for analysis. The remaining 7% were still under investigation. The same proportion of non-hate crime offences had been assigned an outcome at the time of data extraction (93%).
Hate crime, England and Wales, year ending March 2026: appendix tables; Table 4 shows that 10% of all hate crime flagged offences had been dealt with by a charge or summons. This was higher than the previous year (8%), which was based on data from 35 forces, so is not directly comparable. The distribution of offences recorded by the police that constituted hate crimes was very different to overall crime. Therefore, to provide more meaningful comparisons charge/summons rates are shown below for certain offence groups.
Figure 2.5 shows that violence against the person, public order offences and criminal damage and arson offences comprised 97% of hate crime flagged offences. This proportion was the same for the 38 forces included in this analysis, suggesting that these forces are broadly representative of all.
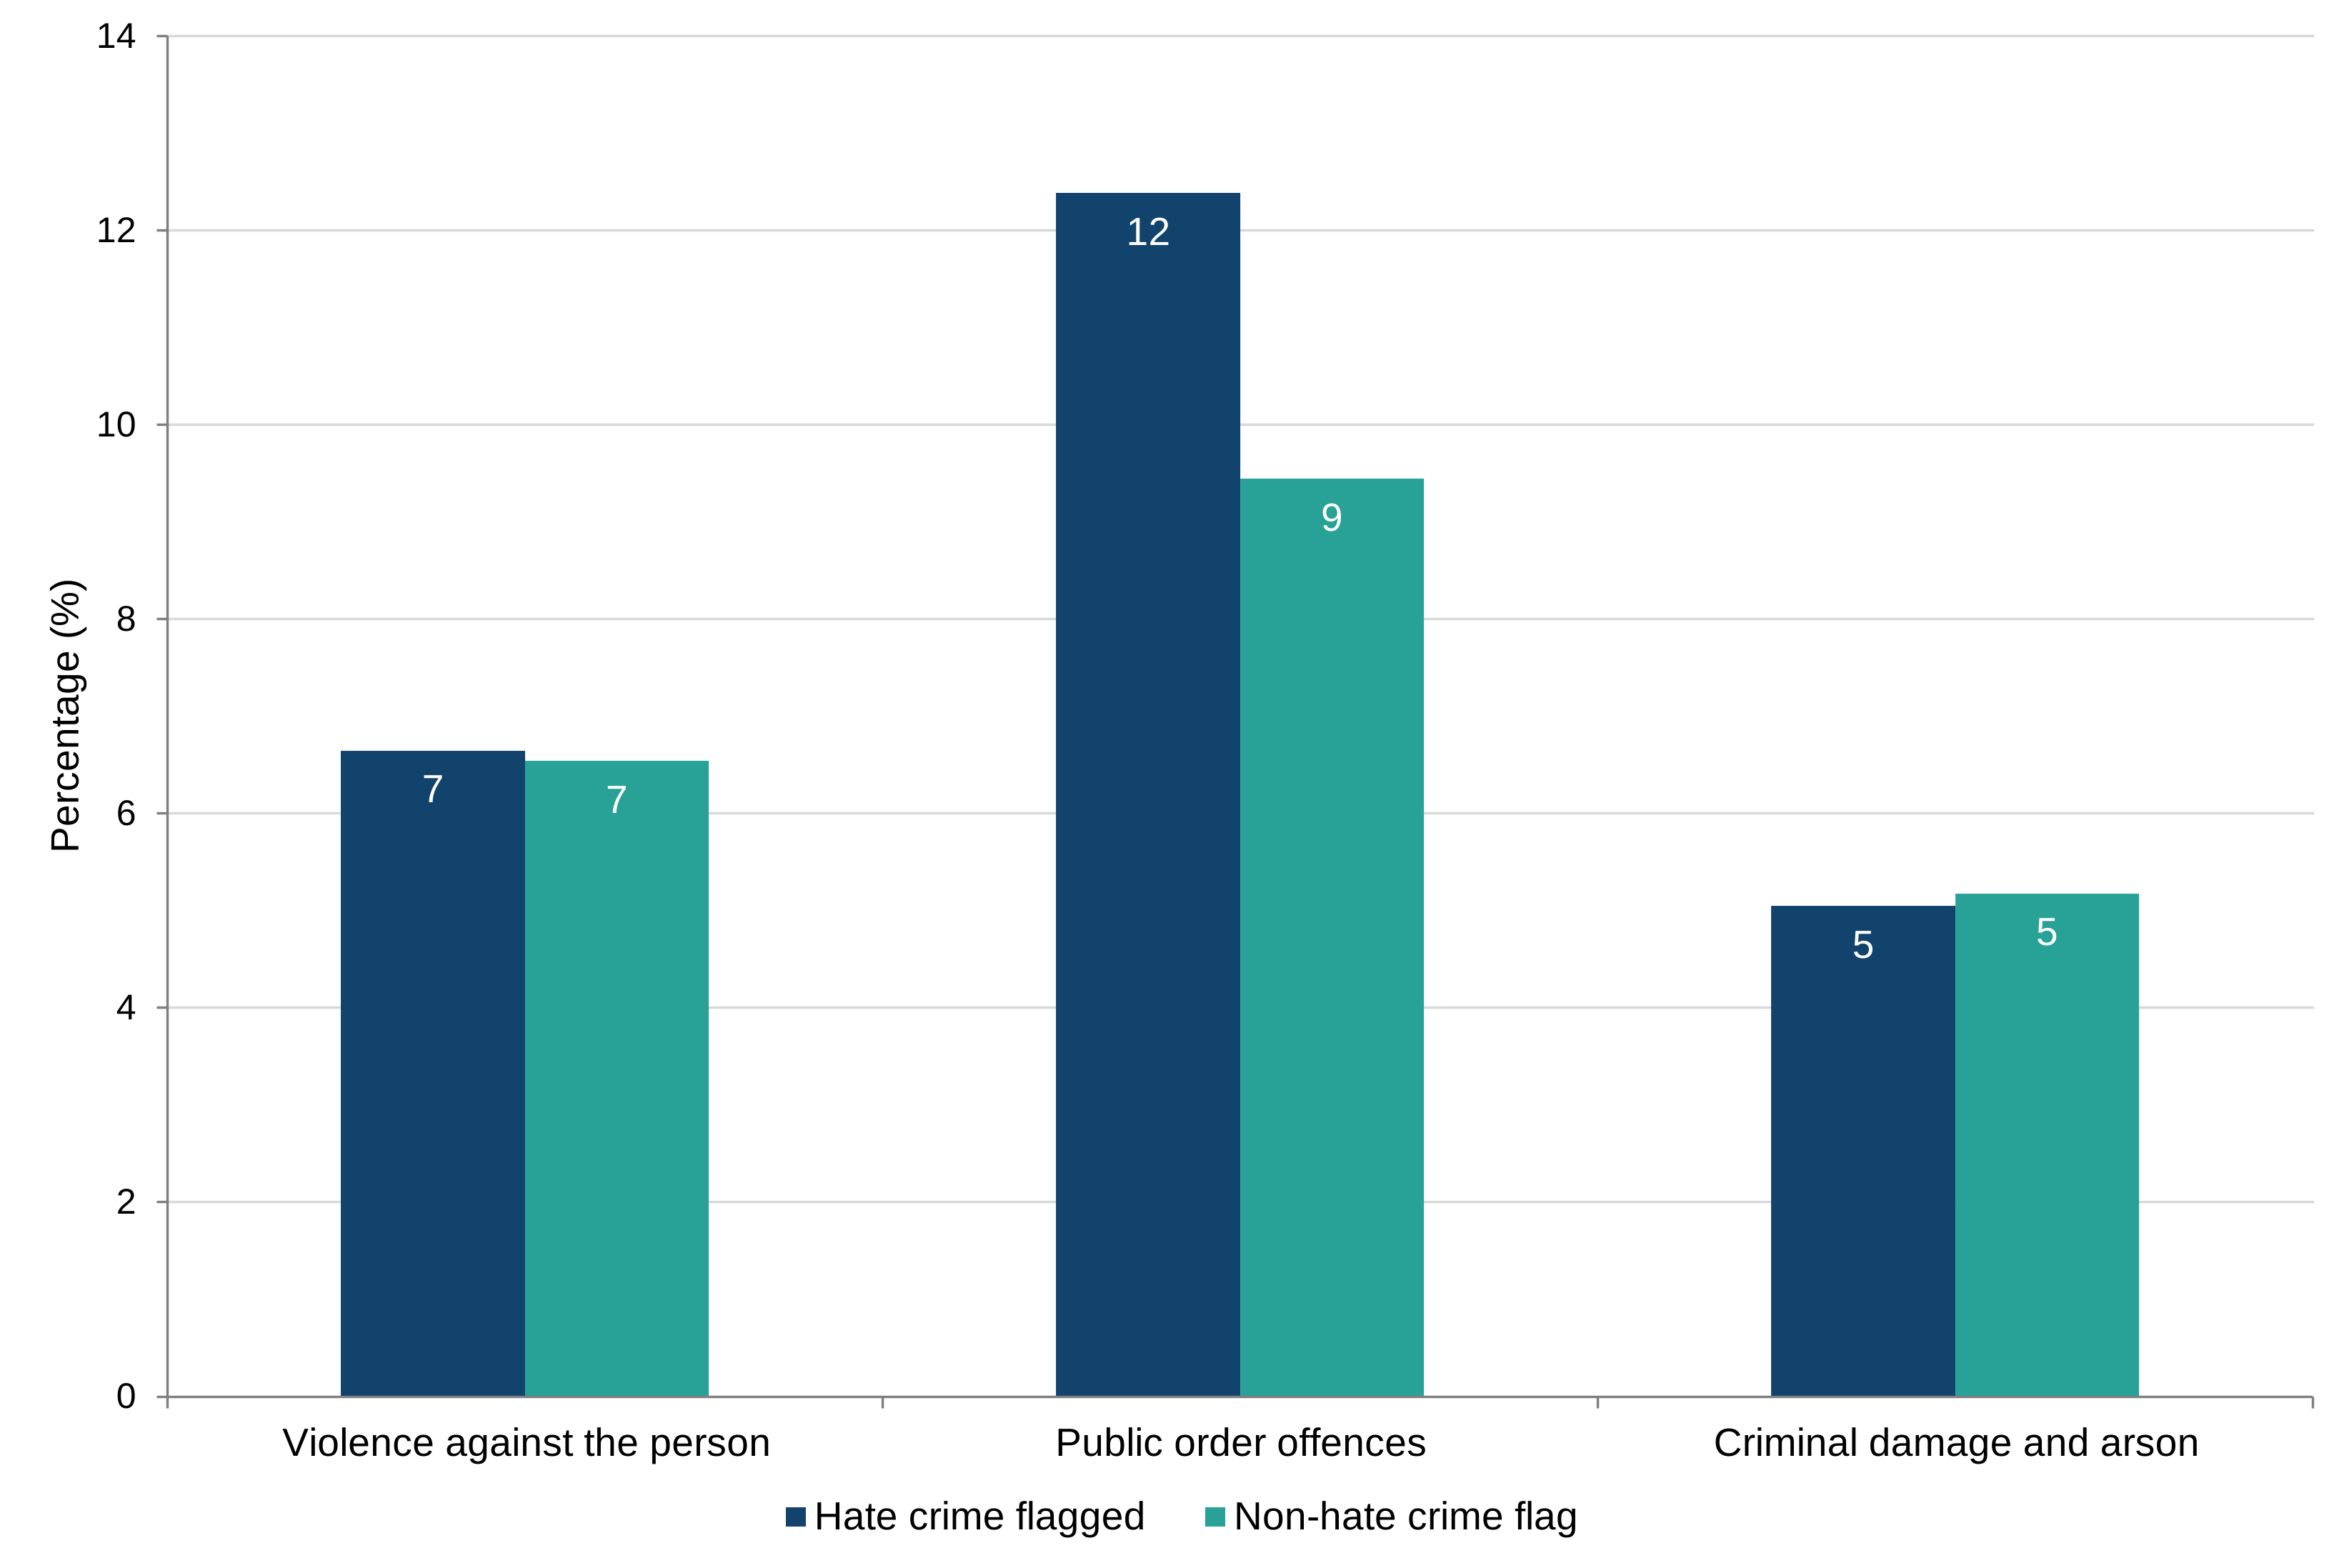
The proportions of outcomes assigned varied by offence type (Hate crime, England and Wales, year ending March 2026: appendix tables; Table 5; Figure 2.10):
- in the latest year, 7% of violence against the person hate crime flagged offence were dealt with by a charge or summons, the same proportion as non-flagged offences (7%); these proportions have moved closer in recent years
- a greater proportion (12%) of hate crime flagged public order offences had been dealt with by a charge or summons compared with non-hate crime flagged public order offences (9%)
- the same proportion (5%) of non-hate crime flagged criminal damage and arson offences had been dealt with by a charge or summons as hate crime flagged criminal damage and arson offences (5%)
Figure 2.10: Percentage of selected offences dealt with by a charge/summons, offences recorded in the year ending March 2026, England and Wales, 38 forces
Source: Police recorded crime, Home Office
The most commonly recorded outcomes recorded for violent offences were for evidential difficulties. Just over half (51%) of violent hate crime offences were dealt with this way, compared with 61% of non-hate crime flagged violence against the person. Figures for all outcomes are shown in Hate crime, England and Wales, year ending March 2026: appendix tables; Table 5.
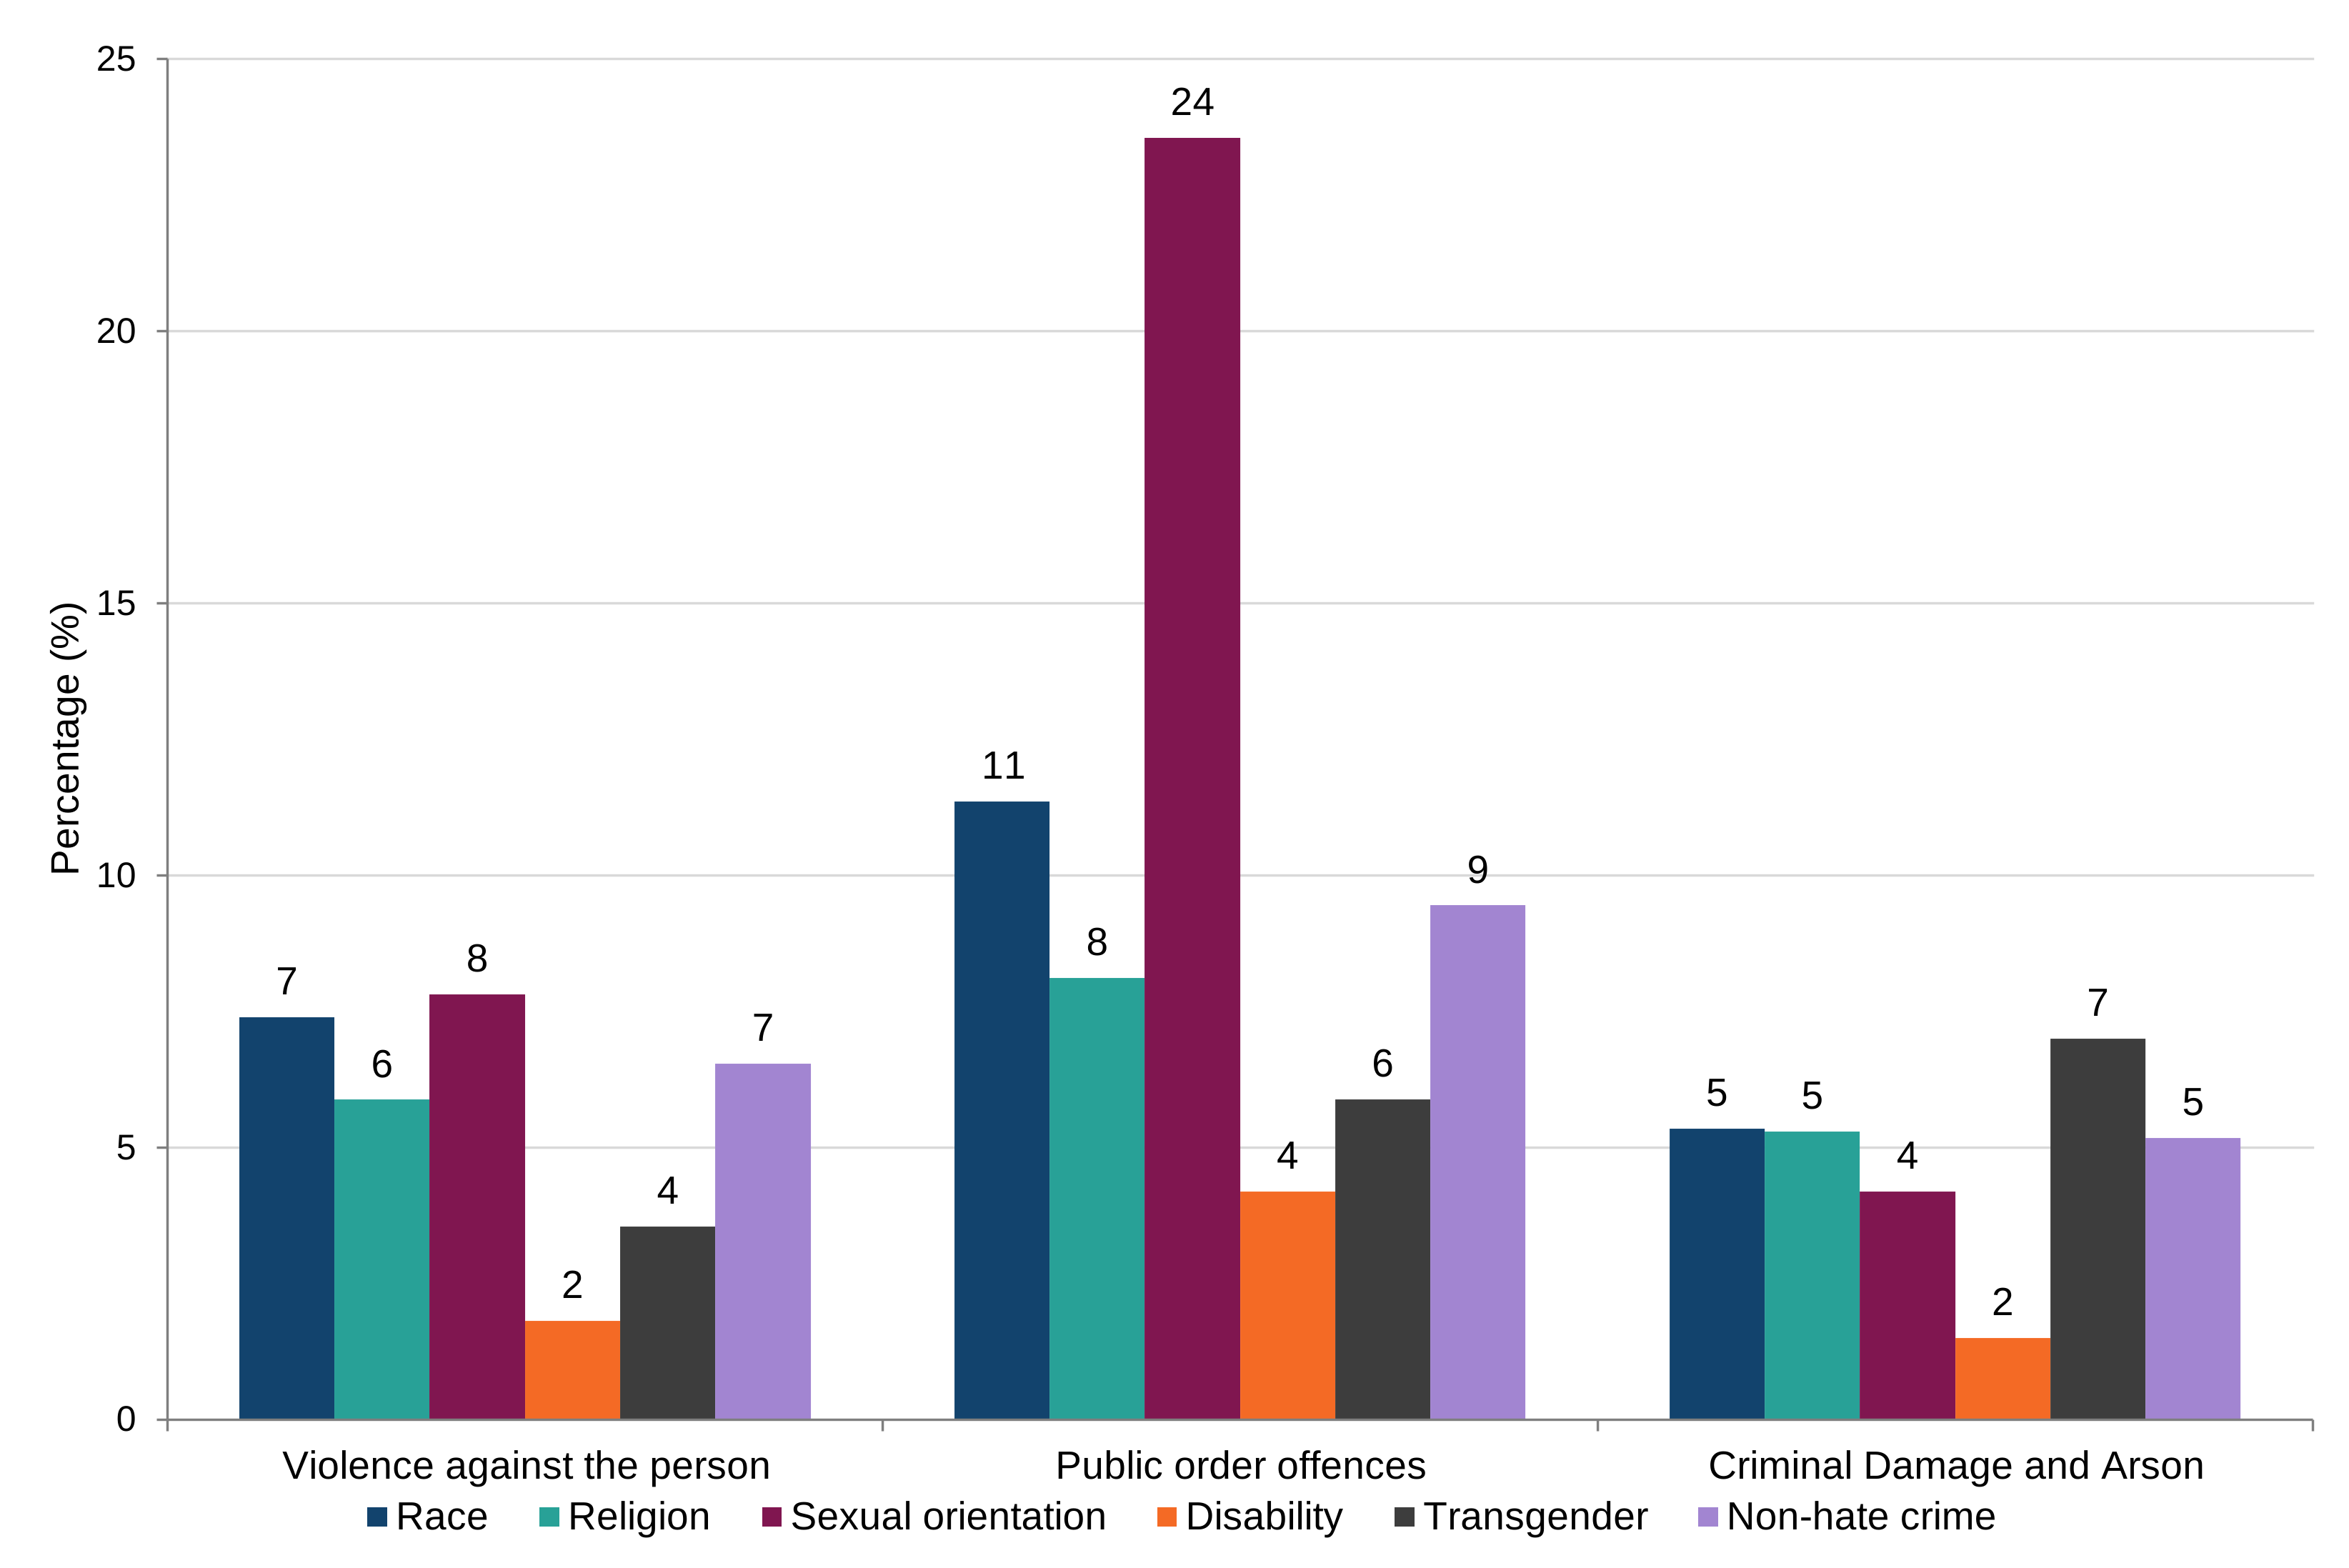
Figure 2.11 shows the proportion of hate crimes that were dealt with by charge or summons for each of the 5 hate crime strands for 3 offence groups.
Figure 2.11: Percentage of selected offences resulting in charge/summons, by hate crime strand, offences recorded in the year ending March 2026, England and Wales, 38 forces
Source: Police recorded crime, Home Office
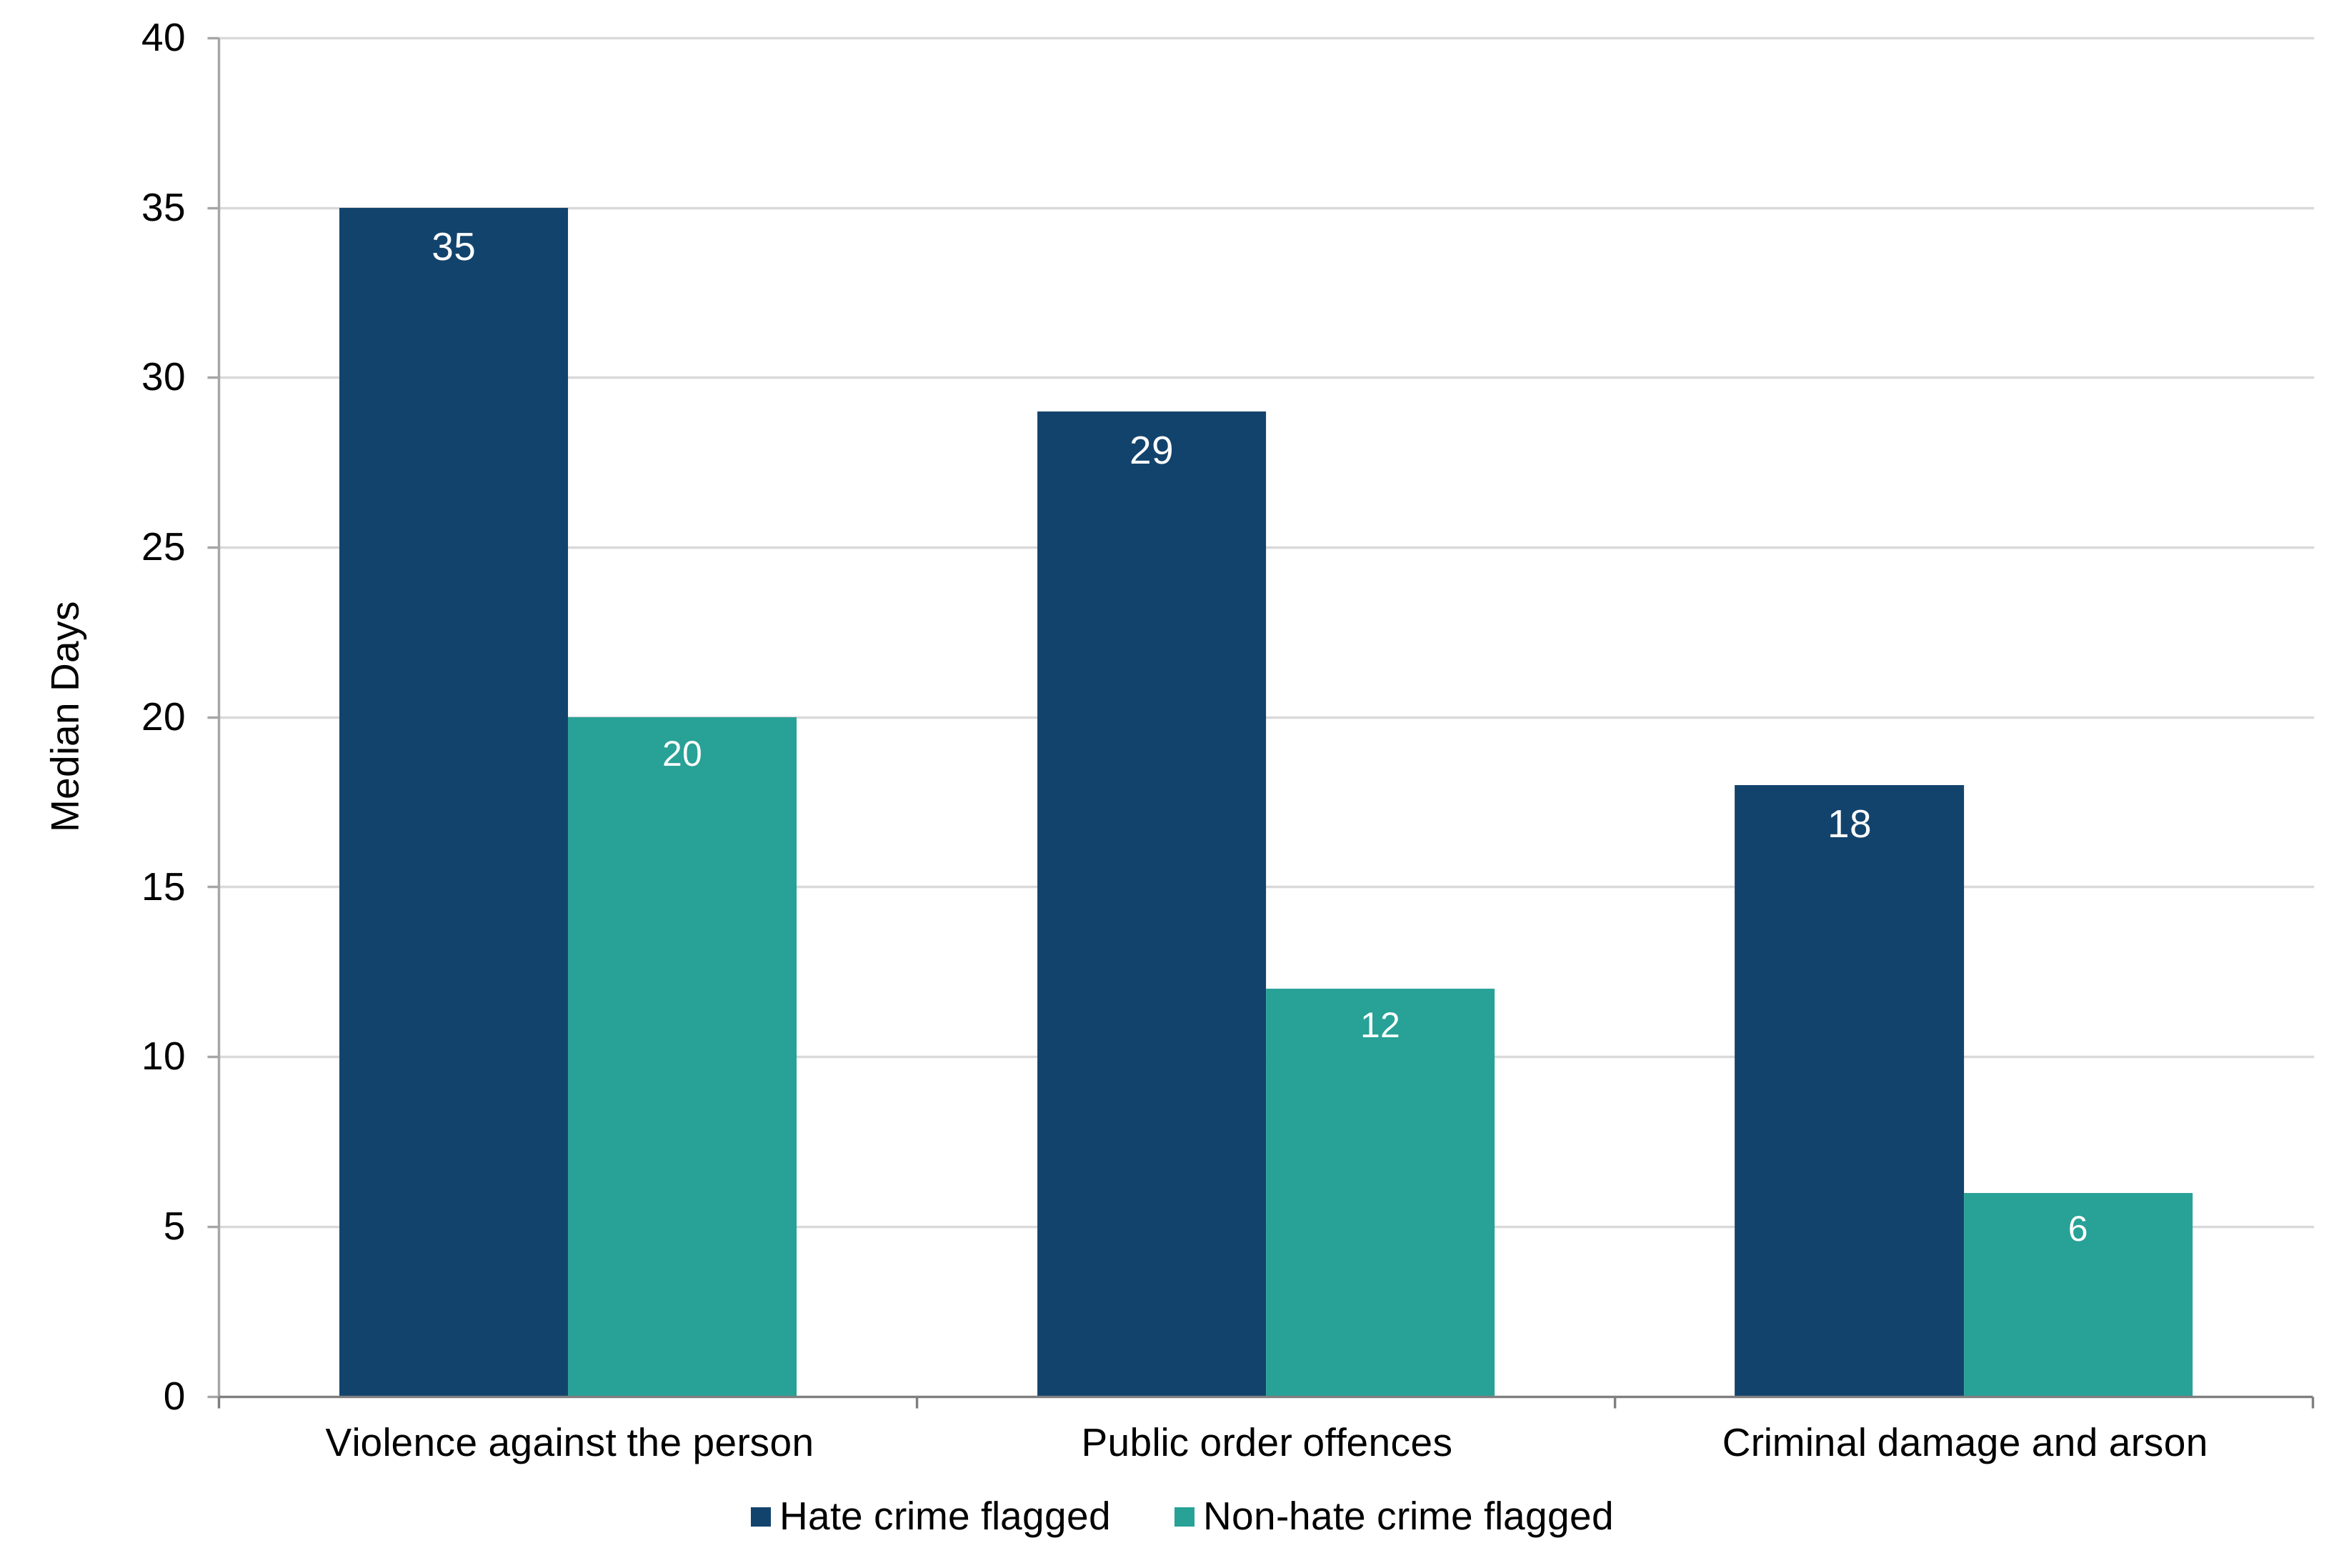
Figure 2.12 shows the median number of days taken, from the date the crime was recorded until it was closed with a final outcome, for selected hate crime and non-hate crime offences. Hate crime offences, on average, took longer to be assigned a final outcome than non-hate crime offences. For example, the median number of days taken for criminal damage and arson hate crime offences was 18 days, compared with 6 days for non-hate crime offences. Similarly, it took longer to compete an investigation of violence against the person hate crime offences (median=35 days) than for non-hate crime flagged violent offences (median=20 days). This may be due to the complexity of these crimes, or the greater investigative effort invested, reflecting the serious nature of these offences.
Figure 2.12: Median number of days taken to assign an outcome, hate crime flagged and non-hate crime flagged offences, outcomes recorded in the year ending March 2026, England and Wales, 38 forces
Source: Police recorded crime, Home Office
3. Online hate crime: official statistics in development
In April 2024, police forces began to transition to the National Data Quality Improvement Service (NDQIS) to assist forces in the identification of whether a crime was committed online (either in full or in part) or not. This information has been combined with the hate crime data to provide information on online hate crime. The data is published as official statistics in development. These are official statistics that are undergoing a development; they may be new or existing statistics, and will be tested with users, in line with the standards of trustworthiness, quality, and value in the Code of Practice for Statistics. The Home Office last published information on online hate crime in the year ending March 2018 hate crime release. Due to concerns about the low accuracy of the data, the Home Office stopped publishing the data.
Data for 35 of the 44 police forces is presented in this section. These 35 forces represent 82% of all hate crime recorded by the police in the last year.
In the year ending March 2026, 7% (8,028 offences) of all hate crime offences were flagged as having an online element, a similar proportion to all police recorded crime (6%). It is likely there will be offences where sufficient information was not available to determine that the crime was committed online, so these figures may be an underrepresentation. Work is ongoing with forces to improve the quality of the online data collection. When the Home Office last published this data in the year ending March 2018, 2% of hate crimes were identified as being online.
When looking at the proportion of hate crime flagged as having an online element by motivating factor, transgender had the highest proportion (16%) followed by religion and disability (both 11%) (Table 3.1 below).
Table 3.1: Proportion of online hate crime offences recorded by the police, by strand, year ending March 2026, England and Wales (35 Forces)
Hate crime strand | Number of online hate crimes | Proportion of total hate crime offences |
|---|---|---|
| Race | 4,744 | 5 |
| Religion | 1,040 | 11 |
| Sexual orientation | 1,618 | 9 |
| Disability | 973 | 11 |
| Transgender | 539 | 16 |
| Total number of motivating factors | 8,914 | |
| Total number of offences | 8,028 | 7 |
Source: Police recorded crime, Home Office
Analysis of online hate crime by offence shows that 43% of online hate crimes were for stalking and harassment offences, with a further 39% for malicious communications (Hate crime, England and Wales, year ending March 2026: data tables; Table 17).
4. Data sources and quality
4.1 Police recorded hate crime overview
In January 2014, the UK Statistics Authority published its assessment of the Office for National Statistics (ONS) crime statistics. It found that statistics based on police recorded crime data, having been assessed against the Code of Practice for Official Statistics (now the Code of Practice for Statistics), did not meet the required standard for designation as National Statistics (now accredited official statistics). The designation was therefore removed and police recorded crime data is not designated as accredited official statistics.
Police forces have made significant improvements in how they record crime since 2014. The HMICFRS, in August 2025, published How effectively do the police record crime?. This report brings together findings from HMICFRS inspection programmes in recent years and outlines how the police have improved their crime recording.
Police forces also improved their identification of what constitutes a hate crime over this time period. Due to these improvements, police recorded crime figures do not currently provide reliable trends in hate crime. The figures do, however, provide a good measure of the hate crime-related demand on the police.
The UK Statistics Authority published a list of requirements for police recorded crime data to regain accredited official statistics designation. Some of the requirements of this assessment were to provide more detail on how data sources were used to produce these statistics, along with more information on the quality of the statistics. Additionally, there was a requirement to provide information on the process used by police forces to submit and revise data, and the validation processes used by the Home Office. To ensure that this publication meets the high standards required by the UK Statistics Authority, details are provided in section 4.2 below.
In May 2022, the Office for Statistics Regulation (OSR) wrote to the Home Office following their compliance review into published hate crime statistics across the UK. The OSR recognised the difficulties in measuring hate crime but found a range of positive features that demonstrate the value and quality of the published statistics in their review.
Additionally, they recognised the difficulty in presenting data on police recorded hate crime without the CSEW estimates to provide context to the numbers, meaning “it is difficult to determine whether police recorded hate crime is increasing”. They stated that they had heard from users of a ‘perception problem’, where “the public is likely to see police recorded crime as the main data source, despite ongoing concerns about data quality” and asked the Home Office to make clear in this publication the limitations of police recorded crime data. Information on the uncertainty of police recorded crime trends is now outlined throughout the publication in response to this recommendation.
4.2 Police recorded crime data sources and validation process
Hate crime data is supplied to the Home Office by the 43 territorial police forces of England and Wales, plus the British Transport Police.
Greater Manchester Police were not able to supply hate crime data for the year ending March 2020 following the implementation of a new IT system in July 2019.
In February 2024, the Metropolitan Police Service (MPS) changed crime recording systems as part of a wider improvement project to replace several legacy IT systems with a single integrated solution.
The new system, CONNECT, is used nationally by several police services and allows more effective and efficient management of data related to intelligence, investigations, custody and other policing functions. In moving to the new system, some data quality issues have been revealed with the legacy crime recording system, CRIS. Under the new CONNECT crime recording system, one record is created for every victim of crime. Under their old system, it was possible for investigating officers to nest more than one offence under a single crime incident report. However, due to limitations of the previous system, if a hate crime identifier was added to one offence within this crime report, this would by default be added to all offences that had also been recorded under that report, whether or not all offences were hate crimes.
For example, if the police attended a public order incident and recorded several offences under the same report, and one of these was identified as being a hate crime, all offences would be counted as a hate crime in the statistics supplied to the Home Office. This means that while the MPS were accurately counting the number of total crimes in line with the Home Office Counting Rules, data in previous years was overstating the number of offences that were hate crimes. Under the new MPS system, each offence has its own crime record, allowing the MPS to improve their data quality by correctly identifying which offences were hate crimes. It should be noted that the over flagging of offences as hate crimes had no downstream impact on the handling or processing of cases within the Criminal Justice System.
Due to the change in the MPS crime recording system, MPS data for the year ending March 2025 and 2026 is not comparable with data supplied in previous years and has been excluded from the trend analysis in this bulletin.
Forces either supply the data at least monthly via the Home Office Data Hub (HODH) or on an annual basis in a manual return. For forces with data on the Data Hub, the Home Office extracts the number of offences for each force which have been flagged by forces as having been motivated by one or more of the monitored strands. Therefore, counts of hate crime via the HODH are dependent on the flag being used for each hate crime offence. It is then possible to derive the count of offences and the monitored strands covered.
In the manual return, police forces submit both the total number of hate crime offences (that is a count of the number of unique offences motivated by one or more of the 5 monitored strands) and the monitored strands (or motivating factors) associated with these offences. From the year ending March 2016, police forces who returned data manually were required to provide an offence group breakdown for recorded hate crimes; prior to the year ending March 2016 only an aggregated total of hate crimes for each of the 5 strands was asked for. It is possible for more than one of the monitored strands (motivating factors) to be assigned to a crime. For example, an offence could be motivated by hostility to race and religion, so would be counted under both strands but would only constitute one offence.
It is known that for some police forces, the addition of tags to crime records could be improved. For example, there may be crimes that are operationally treated as a hate crime but were not correctly identified as a hate crime on their crime recording system. In July 2018, His Majesty’s Inspectorate of Constabulary and Fire & Rescue Services (HMICFRS) published a report on how the police deal with hate crime, including how crimes are flagged. Findings included a lack of recognition in forces about how important the flagging of hate crimes is and concerns around the lack of effective audit arrangements to check flags had been applied correctly.
The full report can be found here: Understanding the difference: the initial police response to hate crime.
Further information on how the police record hate crime can be found in the College of Policing’s Authorised Professional Practice guidance on hate crime publication, launched in October 2020.
At the end of each financial year, the Home Office carry out a series of quality assurance checks on the hate crime data collected from the police forces (either by aggregate return or via the HODH).
These include checking:
- any large or unusual changes in hate crimes from the previous year
- outliers
- that the number of hate crimes by strand is higher than the total number of offences
Police forces are then asked to investigate these trends and either provide an explanation or resubmit figures where the quality assurance exercise identifies data quality issues.
The data is then tabulated by monitored strand and year and sent back to forces for them to verify. At this stage, they are asked to confirm in writing that the data they submitted is correct and if it is not, then they have the opportunity to revise their figures.
From April 2016, the Home Office began collecting information from the police on the perceived religion of victims of religious hate crimes – that the religion targeted by the offender. While in the majority of offences the perceived and actual religion of the victim will be the same, in some cases this will differ. For example, if anti-Muslim graffiti is sprayed on a religious temple of another faith, this would be recorded as an offence of racially or religiously aggravated criminal damage and flagged by the respective police force as a religious hate crime against Muslims. This collection was voluntary in the year ending March 2017 and made mandatory for the year ending March 2018.
From April 2021, the Home Office has begun the collecting the ethnicity of the victims of racial hate crimes recorded by the police. This data was originally published based on officer-defined ethnicity. From the year ending March 2024, this data has been published on self-defined ethnicity.
4.3 Crime Survey for England and Wales (CSEW)
CSEW estimates are accredited official statistics and were independently reviewed by the Office for Statistics Regulation in October 2024. They comply with the standards of trustworthiness, quality and value in the Code of Practice for Statistics.
The CSEW is primarily an interviewer-administered face-to-face victimisation survey in which people (aged 16 years and over) resident in households in England and Wales are asked about their experiences of selected crimes in the 12 months before the interview. It tracks long-term crime trends from year ending (YE) December 1981 to YE March 2025.
The size of the CSEW sample means the number of hate crime incidents and victims estimated in a single survey year is too unreliable to report on. Therefore, 3 annual datasets are combined to provide a larger sample which can be used to produce robust estimates for hate crime. As 3 years’ worth of data has been combined, the CSEW estimates for hate crime are not suitable for examining short term changes in hate crime.
Estimates from the CSEW were last published in the Hate crime, England and Wales, year ending March 2025 statistical bulletin, based on interviews between April 2022 and March 2025.
4.4 Understanding differences between the CSEW and police recorded hate crime
Statistics on police recorded hate crime are published on an annual basis, with estimates from the CSEW normally published every third year. However, the face-to-face CSEW was suspended due to public health restrictions during the COVID-19 pandemic. The estimates in this bulletin, for the combined surveys from the year ending March 2023 to the year ending March 2025, are the first published estimates since the Hate Crime, England and Wales, year ending March 2020 release.
Trends in police recorded and CSEW hate crime have been notably different over the time periods that both data sources are available. Police recorded hate crime has risen, while the CSEW has shown a fall over the longer-term. The main reason for this difference will be due to the improvements to recording processes and practices made by the police since 2014. HMICFRS have conducted a range of inspections related to police forces’ crime and incident recording practices in recent years. In 2014, Crime recording: making the victim count concluded that 33% of cases involving violence were not recorded by the police in England and Wales. Improvements made by the police have been outlined in How effectively do the police record crime?.
These improvements have made substantial contributions to rises in recorded crime from 2014. This effect has been more pronounced for some crime types, such as violence against the person and public order offences. These offences account for 9 in 10 (93%) of police recorded hate crimes, meaning police figures do not currently provide reliable trends in hate crime.
Additionally, there are a number of differences in the coverage of the CSEW and police recorded crime.
The CSEW is a victimisation survey which covers adults aged 16 and over resident in households in England and Wales. Police recorded crime figures includes crimes against people of all ages, against society (crimes where there is not a direct victim such as public order offences) as well as businesses and institutions. This is a key difference for hate crime offences as public order offences are not well covered by the CSEW, as many of these offences will not involve a specifically identifiable victim. Conversely, public order offences account for over a half of police recorded hate crime.
The sources cover different time periods. The most recently available CSEW data was for the combined 3 annual datasets – the year ending March 2023 to the year ending March 2025. Furthermore, as respondents are interviewed throughout the survey year for their experiences of crime in the year to interview, the 3-year survey period actually relate to a near 4-year period. This is required to produce more robust estimates on numbers of hate crimes per year from the survey. The CSEW will therefore only give a very broad estimate of the level of hate crime in England and Wales across these 4 years and will not provide any information on whether the level of hate crime has changed in this period.
Police recorded hate crime data is available on an annual basis. In addition, for racially or religiously aggravated offences, data is available for all police forces in England and Wales on a monthly basis so trends in these crimes around events such as the EU Referendum and the terrorist attacks in 2017 can be examined. However, as mentioned above it is known that police recorded crime data has been heavily affected by improvements in crime recording by the police over recent years, so data from the police is limited in assessing longer-term trends in hate crime.
Other differences in coverage include:
- respondents to the CSEW might misunderstand the survey questions; when they are asked whether they think a crime was committed because of a motivating factor, they may instead be responding based upon their perceived vulnerability; this is likely to be a reason why the estimate of disability hate crime is much higher in the CSEW than the number of these offences recorded by the police
- the respondent is asked in the survey whether the hate crime incident came to the attention of the police and, not whether the police actually recorded a crime (the police may witness an incident and decide that a crime was not committed, for example)
- similarly, while a respondent might say the crime did come to the attention of the police, the survey does not ask whether the respondent told the police that they thought it was motivated by one of the 5 hate crime strands; it is possible that some offences estimated by the survey may have been recorded by the police as a crime, but not specifically as a hate crime
- in the recording of a crime, it might not become apparent that there was a motivating hate factor, meaning that police may not ask the direct question whether the victim thought that the crime was a hate crime
5. Further information
Accompanying tables
The data tables can be found here: Hate crime, England and Wales, year ending March 2026.
Other related publications
Previous hate crime statistical bulletins published by the Home Office are available here: Hate crime statistics.
The Office for National Statistics publishes quarterly publications on crime in England and Wales: Crime and justice .
Information on Crime outcomes in England and Wales statistics.
Police recorded crime and outcomes open data tables.
The True Vision website contains more information about hate crime and how to report it: The police don’t tolerate hate crime.
The Crown Prosecution Service website also carries information about hate crime, including policy and guidance and performance information, which can be found here: Hate crime.
Hate crime statistics for Northern Ireland can be found here: Hate Motivation Statistics.
Hate crime statistics for Scotland for the year ending March 2026 can be found here: Hate crime in Scotland, 2025 to 2026.
Please note: Figures published by the Scottish Government are based on the number of offenders charged, rather than police recorded crime.
Feedback and enquiries
We welcome feedback on the annual statistics release. If you have any feedback or enquiries about this publication, please contact Crime and Policing Statistics via [email protected].
Source: www.gov.uk