



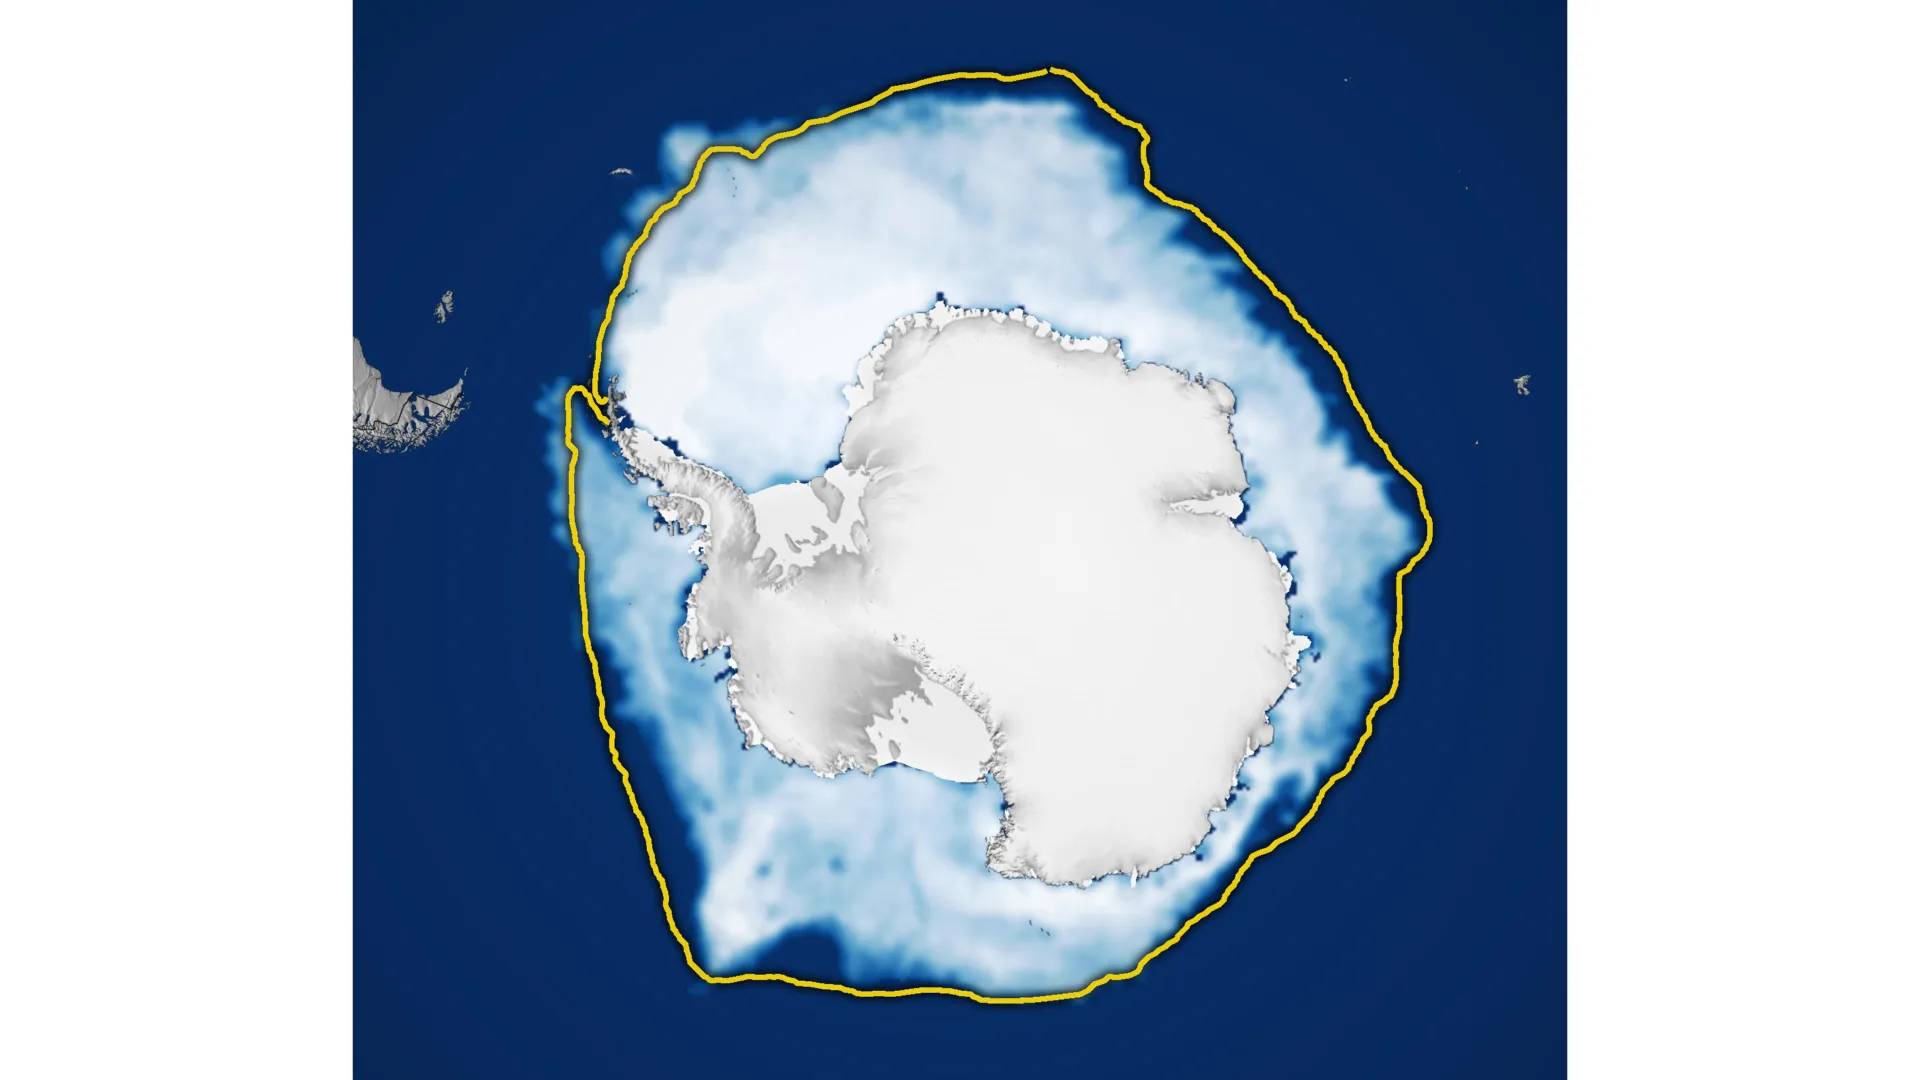

Antarctic sea ice reached its annual winter peak in September 2026, but the ice covered less ocean than in nearly any other year since satellite measurements began. Its maximum extent was the third lowest on record, adding to growing evidence of a dramatic shift in Antarctica’s frozen waters.
Antarctica is surrounded by a vast ocean, giving its sea ice plenty of room to spread outward during the Southern Hemisphere’s winter. This differs from the Arctic, where an ocean basin is enclosed by surrounding land. Although Antarctica’s geography allows winter sea ice to expand over enormous distances, it also pushes the ice into warmer latitudes, where melting becomes more likely during summer. As a result, Antarctic sea ice generally reaches its largest extent in September before shrinking to its annual minimum in February.
According to NASA and the National Snow and Ice Data Center (NSIDC), Antarctic sea ice likely reached its annual maximum extent on September 14 (above). At its peak, the ice stretched across approximately 17.59 million square kilometers (6.79 million square miles). That made 2026 the year with the third-lowest winter maximum in the satellite record.
The maps below illustrate how Antarctic sea ice changes between seasons, showing average ice concentrations in September (left) and the following February (right) from 1990 to 2026. Solid white regions represent areas with the greatest ice coverage, while dark blue indicates open ocean. Only locations where ice covers at least 15 percent of the water are included. Scientists use this threshold to determine which areas qualify as ice-covered when calculating the total “sea ice extent.”
Antarctic Sea Ice Shifts From Record Growth to Historic Lows
For decades, Antarctic sea ice appeared to be moving in the opposite direction from the rapidly shrinking ice in the Arctic. Between 1979 and 2014, sea ice extent around Antarctica increased by approximately 1 percent per decade. However, because Antarctic ice coverage naturally fluctuates considerably from year to year, researchers remain uncertain whether this gradual increase reflected a meaningful long-term change.
The expansion became particularly noticeable between 2012 and 2014, when Antarctic winter sea ice set new record highs for three consecutive years. These records stood in stark contrast to conditions at the opposite pole, where Arctic sea ice was undergoing a steep decline.
But Antarctica’s upward trend ended in 2015. Beginning in 2016, the region experienced substantial losses in sea ice coverage, marking a striking reversal from the preceding decades. Although some years have brought modest recoveries, Antarctic sea ice has generally remained below its historical average.
The most extreme conditions occurred in 2023, when Antarctica recorded both its lowest summer minimum and its lowest winter maximum since satellite observations began. The unusually low maximum in 2026 adds another significant measurement to this changing picture. Scientists are continuing to track the ice each year to determine whether these declines represent a lasting transformation in Antarctic sea ice conditions or fall within the range of statistical variability.
How Satellites Track Antarctic Sea Ice Through Clouds
Scientists measure Antarctic sea ice using satellites equipped with instruments called passive microwave sensors. Rather than relying on visible light, these instruments detect microwave energy naturally emitted by Earth’s surface.
Sea ice produces a stronger microwave signal than open ocean water, allowing researchers to distinguish frozen areas from ice-free seas. An important advantage of this approach is that microwaves can pass through clouds. This means scientists can repeatedly observe Antarctic sea ice even when thick cloud cover prevents conventional satellite cameras from seeing the surface.
The long-running satellite record began in late 1978 with observations from NASA’s Nimbus-7 spacecraft. Starting in 1987, satellites operated under the Defense Meteorological Satellite Program (DMSP) contributed additional measurements. NASA’s Aqua satellite also provided data between 2002 and 2011.
The monitoring effort continues to evolve as satellite technology changes. In 2025, researchers began incorporating observations from the Japan Aerospace Exploration Agency’s GCOM-W satellite, helping maintain the decades-long record used to understand Antarctica’s changing ice.
NASA Earth Observatory images by Michala Garrison, using data from the National Snow and Ice Data Center.
Source: www.sciencedaily.com