





An AD drug target compendium
To identify drug targets and medicines that could be repurposed for AD, we developed a genome–phenome association analytic framework composed of three key components: (1) genetics-based MR analysis (Fig. 1a); (2) experimental validation in neurons and brain organoids derived from patient-derived induced pluripotent stem (iPS) cells, as well as in a transgenic mouse model of AD (5xFAD) (Fig. 1b); and (3) real-world patient data-based drug repurposing validation (Fig. 1c).
a, A framework illustrating MR analysis for AD. The MR analysis workflow includes two parallel parts. Top: steps of MR-based drug target identification and validation. IVs corresponding to 1,229 druggable targets were selected from 3 pQTL and 9 eQTL datasets across 5 brain regions. In total, 7 GWAS summary statistics datasets, comprising 275,540 AD cases and 1.55 million controls of African American and European American ancestry, were used as outcome datasets (Methods). Five MR methods were used to enhance the reproducibility and rigor of drug target findings. b, Neurons from healthy and patient-derived iPS cells and a transgenic mouse model of AD (5xFAD) were used to validate drug targets. c, A framework illustrating DWASs. In total, 210 highly prescribed drugs were evaluated after adjusting for various confounding factors (such as age, sex, race and disease comorbidities) using 1:1 propensity score matching (PSM). LD, linkage disequilibrium.
We conducted MR analyses to identify potential drug targets from 1,229 druggable proteins (Extended Data Fig. 1). A protein was considered druggable if targeted by known FDA-approved medicines or investigational molecules with binding affinity lower than 1 µM (Methods). Next, we selected single nucleotide polymorphisms (SNPs) as valid instrumental variables (IVs; false discovery rate (FDR)-adjusted P values < 0.05 and F-statistics > 10) for each protein-coding gene from three protein quantitative trait loci (pQTL) and nine gene expression quantitative trait loci (eQTL) datasets (Fig. 1, Extended Data Fig. 1 and Supplementary Table 1) derived from the Religious Orders Study/Memory and Aging Project (ROSMAP)14, MetaBrain15 and Mayo Clinic Biobank16. We also gathered seven AD GWAS summary statistics datasets from EA or AA individuals (Supplementary Table 2) and implemented five complementary MR models17,18 (Extended Data Fig. 1; Methods) using multiple lines of evidence to strengthen our findings.
The DWAS analysis provides real-world patient data for drugs with targets prioritized by MR analyses. However, this approach is limited to FDA-approved drugs with sufficient participants in the patient database, leaving many MR-prioritized targets unvalidated. Therefore, we performed experimental validation of top MR-prioritized targets using iPS cell-derived neurons and brain organoids from patients with AD (Fig. 1), complemented by in vivo validation in 5xFAD mice for compounds at the preclinical or clinical investigation stage.
Alzheimer’s MR score prioritized druggable targets
Considering the multiple genetic and genomic datasets and methods used in MR analysis, we used a consensus Alzheimer’s MR score (alzMR score) to quantify the sensitivity of genetic evidence from MR (Supplementary Methods). We performed simulations to illustrate that the alzMR score (Supplementary Fig. 1) accurately identifies genes with the strongest genetic evidence and distinguishes between pairs of genes with similarly strong evidence. The Cauchy combination test (Supplementary Methods) further validated the robustness of the alzMR score across seven GWAS datasets from EA, despite partial participant overlapping among them (Supplementary Table 3). Notably, the alzMR score demonstrated sensitivity in distinguishing genetic signals when comparing clinically diagnosed AD GWAS datasets with proxy AD datasets (r = 0.69; Extended Data Fig. 2). This suggests that the alzMR score captures consistent signals across subsequent AD GWAS studies while accounting for variations in study population characteristics and diagnosis criteria.
We first applied the alzMR score to prioritize genes with likely causal effects on AD based on MR results significant at FDR < 0.05. Genes with alzMR score > 0 were classified as antagonistic targets, for which inhibition could provide therapeutic benefit, whereas genes with alzMR score < 0 were classified as agonistic targets, for which activation could provide therapeutic benefit. We prioritized drug targets that met the following conditions: (1) AD clinical trials completed or ongoing for the target; (2) validation of the FDA-approved drugs for the target using DWAS analysis; (3) target colocalization with posterior probabilities of hypothesis 4 (PP.H4) > 0.5; and (4) targets having fine-mapping of causal gene sets (FOCUS19) with posterior inclusion probabilities (PIPs) > 0.5. These criteria identified 73 drug targets associated with elevated (39 antagonistic targets) or reduced (34 agonistic targets) risk of AD with EA at FDR < 0.05 (Fig. 2 and Supplementary Table 4), based on Wald ratio and inverse-variance-weighted (IVW) methods. Angiotensin-converting enzyme (ACE; alzMR score = −199.12) and eukaryotic translation initiation factor 4E (alzMR score = −111.51) were the top 2 agonistic targets (Fig. 2 and Supplementary Table 4). ADAM metallopeptidase domain 10 (ADAM10; alzMR score = 133.56), lactamase-β (alzMR score = 165.47), ERCC excision repair 2 (alzMR score = 126.20), epoxide hydrolase 2 (EPHX2; alzMR score = 195.69) and epidermal growth factor receptor (EGFR; alzMR score = 121.84) were the top 5 AD antagonistic targets (FDR < 0.05; Fig. 2 and Supplementary Table 4). The MR results of agonistic and antagonistic drug targets were consistent across different MR methods (Extended Data Fig. 3). The top druggable targets with a stronger alzMR score were also replicated in an independent AD GWAS20 with clinically diagnosed AD cases, including EPHX2, ACE, ADAM10, PRKCB, FOLH1, EGFR, CHRNE, TAS2R60 and CD38. Among them, ACE (PP.H4 = 0.77), ADAM10 (PP.H4 = 0.71) and CTSH (PP.H4 = 0.97) showed colocalization between pQTL in the cortex and AD GWAS loci21 (Supplementary Fig. 2 and Supplementary Table 5). The eQTL for ADAM10 (PP.H4 = 0.98), CTSH (PP.H4 = 0.84) and EGFR (PP.H4 = 0.99) from multiple brain regions also colocalized with genome-wide significant AD GWAS loci. We also fine-mapped eight targets in AD (FOCUS PIP > 0.5; Supplementary Fig. 3 and Supplementary Table 6), including ACE, MAPT, EGFR, LACTB, EPHX2, ADAM10, PTGDR and DMPK.
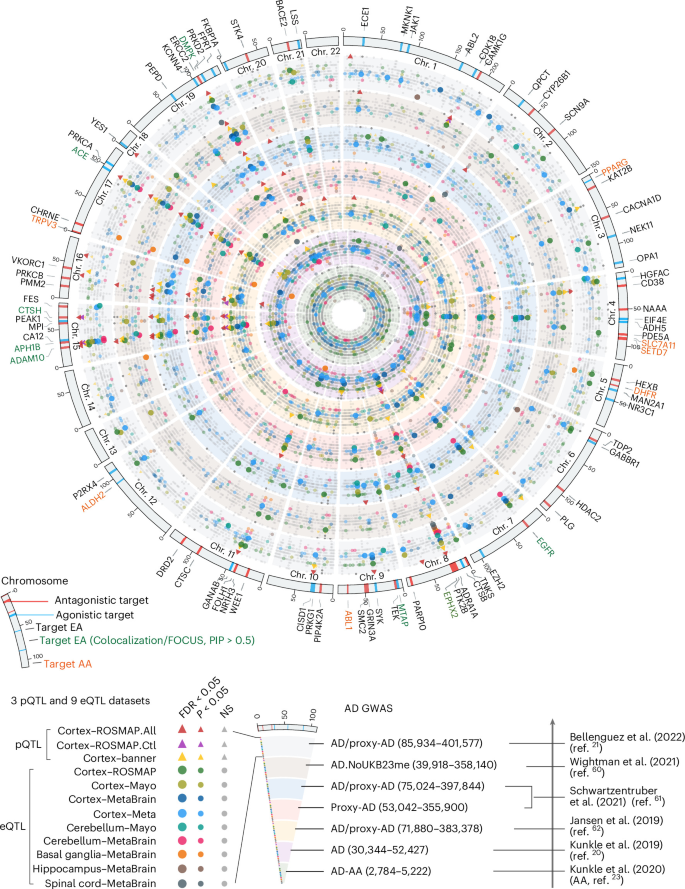
Circle plot illustrates MR (IVW method) results for 1,229 druggable targets across three pQTL datasets (triangles), nine eQTL datasets (circles) and seven AD GWAS datasets (distinguished by different background colors; six EA20,21,60,61,62 and one AA23). P values are two-sided, derived from a Wald test of the IVW MR estimate against the standard normal distribution; multiple testing was controlled by the Benjamini–Hochberg FDR. Larger colored shapes denote FDR-corrected significance < 0.05; smaller colored shapes denote P < 0.05; gray shapes denote nonsignificant MR results. The outer circle shows chromosome position, with tick labels denoting the rank of each drug target in human hg19 genome reference. Blue lines in the chromosome circle indicate agonistic targets, whereas red lines indicate antagonistic targets. The 73 putative targets for EA include at least one MR result with FDR < 0.05. Green text highlights druggable targets for EA that were positive for colocalization or FOCUS fine-mapping (PP.H4 or PIP > 0.5). The seven suggestive targets for AA are highlighted in orange text at P < 0.05 across at least three MR tests with the top alzMR score. NS, nonsignificant.
Next, we examined top-prioritized MR targets using 17 cell-type-specific eQTL datasets and identified 20 targets (for example, APH1B, EGFR, ADAM10, PTK2B, EPHX2, KCNN4, CTSH and ACE) with significant MR results (FDR < 0.05) in at least three AD GWAS and cell-type-specific eQTL pairs (Supplementary Fig. 4). The most significant targets were identified in excitatory neurons, and colocalization of APH1B (PP.H4 = 0.77) and CTSH (PP.H4 = 0.99) was validated in four AD GWAS datasets (Supplementary Fig. 2). We also identified two druggable targets (KCNN4 and PTK2B) with significant MR scores in microglia and bulk human brain eQTL and pQTL datasets (Figs. 2 and 3). Colocalization between AD GWAS and microglia chromatin accessibility QTL has been independently confirmed for the KCNN4 locus in a microglia-specific regulome analysis22.
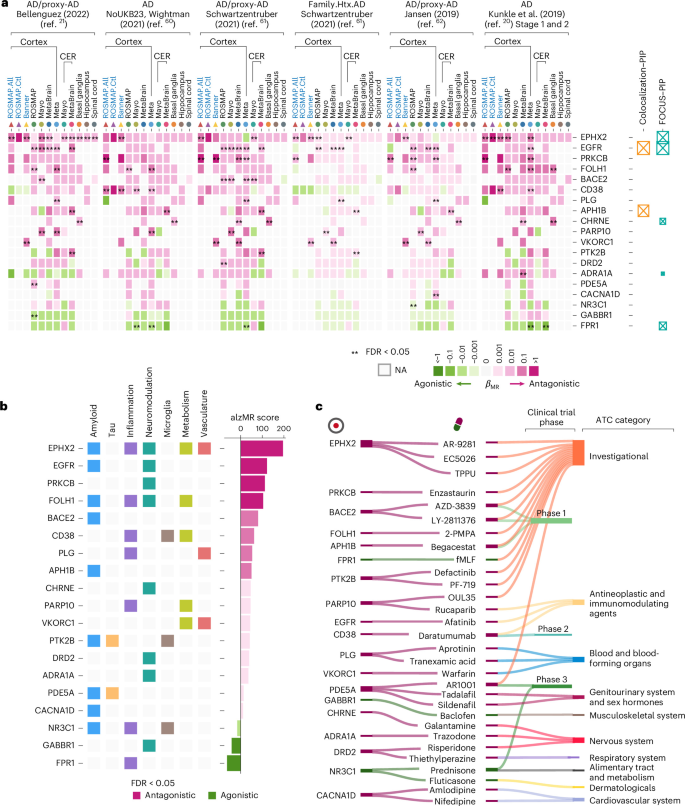
a, Heat map shows the βMR coefficient score of 19 drug targets for EA20,21,60,61,62. βMR > 0 indicates an antagonistic target; βMR < 0 indicates an agonistic target. Asterisks (**) denote significance at FDR < 0.05, corrected for multiple testing using the Benjamini–Hochberg method. NA, not available for MR analysis due to the lack of valid instrumental variables. b, Distribution of AD drug targets across MoA categories. The left panel shows the distribution of the 19 targets across seven MoA categories: amyloid, tau, inflammation, neuromodulation, microglia, metabolism and vasculature. The right bar graph presents the alzMR score of 19 drug targets: ruby denotes antagonistic targets and green denotes agonistic targets. c, Sankey plot shows the relationship between repurposed drugs and their alzMR-score-predicted targets for AD. Dark green indicates that the drug acts as an agonist of the target; ruby indicates that the drug acts as an inhibitor/antagonist of the target.
We also conducted MR analysis using an AD GWAS dataset of AA ancestry (2,784 AA AD cases and 5,222 AA control individuals23 (Fig. 1). We first ranked putative targets for AA using alzMR score and defined targets in AA using MR P < 0.05 in at least three xQTL × AA AD GWAS pairs. This prioritized five antagonistic (dihydrofolate reductase (DHFR), SLC7A11, TRPV3, ABL1 and SETD7) and two agonistic drug targets (ALDH2 and PPARG) for AD in AA individuals (P < 0.05; Fig. 2 and Supplementary Table 7) by eQTL IVs.
AD target discovery from GWASs with EA
We next focused on 19 high-confidence AD drug targets (top 2% of 1,229 druggable targets) in EA (Fig. 3) based on three factors: (1) MR evidence (Fig. 2); (2) consistent direction of alzMR scores with the experimentally reported mechanism of action (MoA) of corresponding drugs24; and (3) targets with druggable pockets based on protein three-dimensional structural analysis (Supplementary Fig. 5). We found four antagonistic drug targets (0.3% of 1,229 targets) with the strongest alzMR scores (FDR < 0.05; Supplementary Fig. 6) across six AD GWAS datasets in EA, including EPHX2, EGFR, PRKCB and FOLH1 (Fig. 3a).
We classified the 19 alzMR-supported targets into seven therapeutic categories based on experimentally reported MoAs2,25 (Fig. 3b and Supplementary Table 8). Anti-amyloid and neuromodulation were the top 2 MoA categories, accounting for 47% (n = 9) and 42% (n = 8) of the 19 targets, respectively (Supplementary Fig. 7a). Most targets in neuromodulation (n = 5; DRD2, CHRNE, ADRA1A, PRKCB and GABBR1) and amyloid (n = 3; BACE2, APH1B and CACNA1D) are annotated as a single MoA (Fig. 3b and Supplementary Fig. 7a). The remaining AD drug targets modulated inflammation (37%; n = 7; EPHX2, NR3C1, FPR1, FOLH1, CD38, plasminogen (PLG) and PARP10), metabolism (26%; n = 5; EPHX2, FOLH1, CD38, PPAR10 and VKORC1) and vasculature (16%; n = 3; VKORC1, PLG and EPHX2) pathways, with most spanning multiple MoAs. Both antagonistic targets (EPHX2 and FOLH1) contribute to more than four AD MoAs (anti-inflammation26 and metabolic pathways26; Fig. 3b), beyond amyloid-β neurotoxicity27,28 and tauopathy28. Thus, genetic data support potent AD drug targets that act on multiple biological pathways extending outside of amyloidopathy and tauopathy.
We next evaluated 17 FDA-approved drugs and 13 investigational molecules corresponding to the 19 AD targets identified by alzMR score in EA (Fig. 3c and Supplementary Table 9; Methods). The 17 approved drugs were classified into nine anatomical therapeutic chemical categories, the top 3 of which were nervous system (for example, drug–target pairs: galantamine–CHRNE), cardiovascular system (amlodipine–CACNA1D) and antineoplastic and immunomodulating agents (daratumumab–CD38). We found that one FDA-approved AD drug (galantamine, targeting CHRNE; alzMR score = 46.53) had significant alzMR score for AD. We also identified 14 investigational molecules corresponding to ten targets (nine antagonistic and one agonistic), such as EC5026 and AR-9281 for EPHX2-encoded soluble epoxide hydrolase (sEH) and 2-(phosphonomethyl)pentanedioic acid for FOLH1 (Fig. 3c).
Among 30 drugs/molecules, seven across six targets are currently or have been tested in AD clinical trials (Fig. 3c and Supplementary Table 9). Phase I AD clinical trials primarily tested anti-amyloid agents, including AZD-3839 (ClinicalTrials.gov identifier: NCT01348737) and LY-2811376 (NCT00838084), small-molecule BACE1 inhibitors that also engage the closely related paralog BACE2 owing to shared active-site homology and begacestat (NCT00959881) as a γ-secretase inhibitor acting on the complex subunit APH1B. These observations reveal that MR analysis reliably identifies existing targets under AD clinical trials (Fig. 3c). Our alzMR scores also identified targets harboring two drugs currently under investigation in phase III AD trials, including prednisone (targeting NR3C1; NCT00000178) and AR1001 (a selective inhibitor of phosphodiesterase 5 (PDE5); NCT05531526).
EPHX2 is a potent anti-inflammatory target supported by AD GWAS
EPHX2, encoding epoxide hydrolase, breaks down neuronal protective metabolites known as epoxy fatty acids29 and induces neuroinflammation and synapse damage in AD (Figs. 3b–5). EPHX2 was one of the strongest antagonistic drug targets prioritized by the alzMR score. Elevated EPHX2 protein expression (pQTL IVs (n = 7) derived from ROSMAP) was significantly associated with elevated AD risk (β (IVW MR) = 0.190; MR P = 7.55 × 10⁻⁸; Fig. 4a). We replicated these results across five other AD GWAS datasets to reduce the potential effects of horizontal pleiotropy and outlier IVs (Fig. 4a and Supplementary Fig. 8).
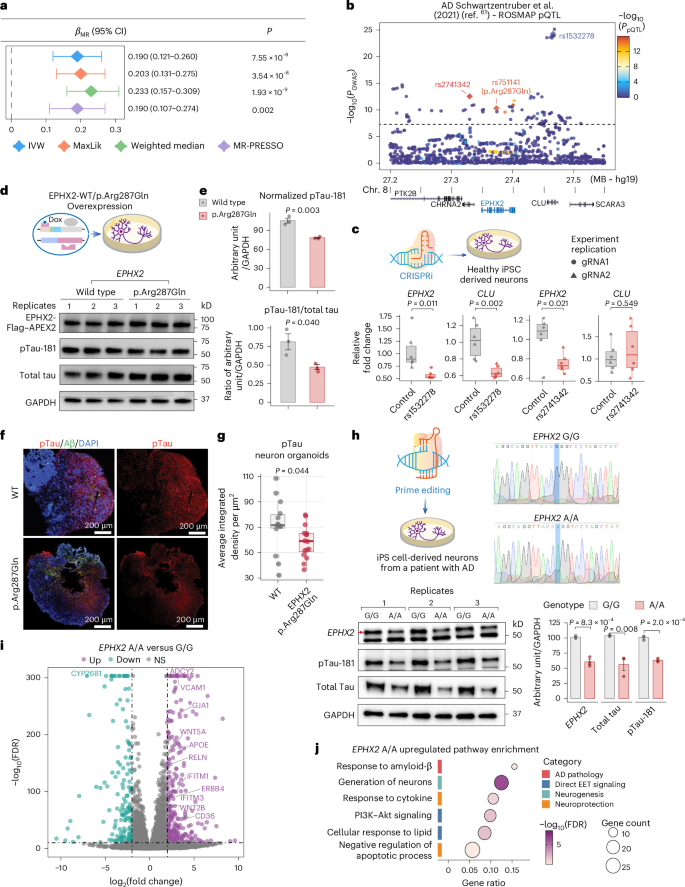
a, Two-sample MR estimates of the likely causal effect of EPHX2 on AD risk21 using ROSMAP cortex pQTL (IVs; n = 7). Four MR methods were applied: IVW, maximum likelihood (MaxLik), weighted median and MR-PRESSO. Diamonds denote the βMR point estimate (center), and horizontal whiskers denote the 95% CI; the dashed line marks the null (β = 0). P values test the null of no causal effect (βMR = 0) and are two-sided. b, Regional plot showing genome-wide significant variants61 associated with AD risk at CLU locus. Gradient color indicates pQTL P values of SNPs. Key variants rs1532278 (CLU), rs2741342 and rs751141 (p.Arg287Gln and EPHX2) are highlighted. c, CRISPRi on the non-coding SNPs rs1532278 and rs2741342 was used to test EPHX2 and CLU expression in healthy iPS cell-derived neurons, using two independent guide RNA experiments with three replicates. Box plots show the median (center line), 25th–75th percentiles (box bounds) and whiskers extending to 1.5 × the interquartile range (IQR); dots are individual measurements. d, Western blotting of pTau levels in iPS cell-derived neurons from patients with AD, overexpressing 3xFlag–APEX2-tagged EPHX2 wild type or the p.Arg287Gln mutant. e, Normalized pTau-181 (top) and pTau-181/total Tau ratio (bottom) in wild-type and Arg287Gln (R287Q) samples. Data are mean ± s.e.m. with individual points (n = 3). f,g, Immunostaining (f) and quantification (g) showing EPHX2–p.Arg287Gln overexpression reduces pTau levels in iPS cell-derived cerebral organoids from patients with AD (wild-type, n = 14; p.Arg287Gln, n = 16). Box-plot elements as in c. h, Prime editing confirms that the EPHX2 A/A genotype reduces EPHX2 protein levels compared to the G/G genotype. Bar plot shows mean ± s.e.m. with individual data points (n = 3). i, Volcano plot of differential gene expression analysis comparing EPHX2 A/A versus G/G genotypes. j, Pathway enrichment analysis suggests that the EPHX2 A/A variant activates neuroprotection, neurogenesis and anti-inflammatory pathways. A one-sided hypergeometric test was used for enrichment analysis with FDR correction for multiple comparisons. P values for c, e, g and h are from two-sided Student’s t-test. MR-PRESSO: Mendelian randomization pleiotropy residual sum and outlier. WT, wild type.
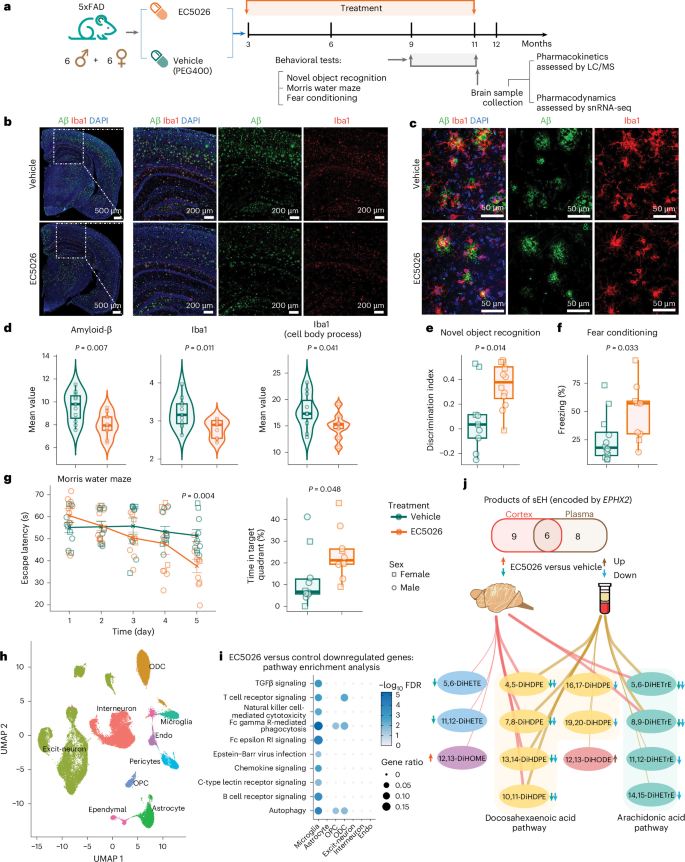
a, Experimental design for EC5026 treatment in 5xFAD mice. We designed 12 mice per group (six female and six male) for the mouse experiments. b, Immunofluorescence images showing reduced amyloid-β plaques and Iba1+ microglia in EC5026-treated versus vehicle-treated 5xFAD mice. c, Enlarged immunofluorescence images showing microglial cell body and processes surrounding amyloid-β plaques following EC5026 treatment. d, Quantification showing that the EC5026 treatment significantly reduced amyloid-β load, Iba1+ microglial density and Iba1+ microglial cell body process complexity. In total, 20 mouse samples were tested (EC5026: n = 9; vehicle: n = 11). Violin plots show the kernel density of the data, in which the width is proportional to the relative frequency of values. The box plot marks the median (center line), the 25th and 75th percentiles (box bounds) and the smallest and largest values within 1.5 × IQR of the box bounds (whiskers). e,f, EC5026-treated mice showed significantly improved cognitive performance in novel object recognition (e) and fear conditioning (f) tests. g, Morris water maze tests escape latency in 5 days and spent more time in the target quadrant during probe trial. Box-plot elements from e–g as in d. P values for d–g are all from two-sided Student’s t-test. h, Uniform manifold approximation and projection clustering of brain cell types in EC5026-treated mouse brain samples using single-nucleus RNA sequencing (snRNA‑seq) analyses (EC5026: n = 3; vehicle: n = 3). i, Pathway enrichment analysis of downregulated genes of EC5026 treatment. j, Liquid chromatography–mass spectrometry analysis of sEH metabolites in cortex and plasma (EC5026: n = 9; vehicle: n = 12), showing relative abundance of diols (DiHETrEs and DiHDPEs). DiHDPE, dihydroxydocosapentaenoic acid; DiHETrE, dihydroxyeicosatrienoic acid; Endo, endothelial cells; Excit-neurons, excitatory neurons; LC/MS, liquid chromatography–mass spectrometry; ODC, oligodendrocyte; OPC, oligodendrocyte precursor cell; TGFβ, transforming growth factor-β; UMAP, uniform manifold approximation and projection.
We next conducted conditional analyses and further functional genomic validation using human-brain single-nucleus assay for transposase‑accessible chromatin sequencing (ATAC–seq) and Hi-C followed by chromatin immunoprecipitation30. EPHX2 pQTL SNP rs2741342 (conditional P = 2.49 × 10⁻⁸) was identified as independent with lead SNP rs1532278 (PGWAS = 5.72 × 10⁻²⁵) in the CLU locus (Fig. 4b, Extended Data Fig. 4a,c and Supplementary Table 10). Additionally, joint association analysis (Supplementary Methods) found that SNPs rs1532278 (CLU), rs751141 (EPHX2), rs2741342 (EPHX2) and rs73223431 (PTK2B) have independent genome-wide significant associations with AD (Extended Data Fig. 4b and Supplementary Table 11). These include the EPHX2–p.Arg287Gln coding variant rs751141 in Bellenguez et al.21 GWAS dataset (joint estimated P = 1.43 × 10⁻⁸) and EPHX2 rs2741342 in Kunkle.Starge220 dataset; joint estimated P = 3.48 × 10⁻⁸). Human hippocampal ATAC–seq analysis further showed that an enhancer harboring the GWAS-assigned AD-risk SNP rs1532278 in CLU was linked to active promoters of EPHX2 (Supplementary Fig. 9). Consistent with this regulatory connection, CRISPR interference (CRISPRi) of rs1532278 reduced both CLU and EPHX2 expression in iPS cell-derived neurons, with no effect on PTK2B expression (Fig. 4c and Extended Data Fig. 4d). However, CRISPRi of SNP rs2741342 only reduced EPHX2 expression, with no effect on CLU and PTK2B (Fig. 4c).
We also found a protein-coding variant of rs751141 (p.Arg287Gln (R287Q)) associated with reduced EPHX2 protein level (\(\beta\) = −0.291; PpQTL = 5.50 × 10⁻¹⁶) and protection from AD in EA21 (\(\beta\) = −0.096; PGWAS = 1.08 × 10⁻¹¹; Fig. 4b and Supplementary Fig. 10). These findings, together with GWAS conditional analysis and protein structural simulations (Supplementary Fig. 11), further support EPHX2 as a potent antagonistic target for AD. We also inspected functional roles of EPHX2–p.Arg287Gln using patient iPS cell-derived neurons and cerebral organoids. Using the transcription activator‑like effector nuclease (TALEN) system31 to insert a doxycycline-inducible overexpressed EPHX2 or EPHX2–p.Arg287Gln at the AAVS1 locus in iPS cell-derived forebrain neurons from patients with AD (Supplementary Fig. 12), we identified reduced phosphorylated tau (pTau) in EPHX2–p.Arg287Gln iPS cell-derived neurons (P = 0.003; Fig. 4d,e) and cerebral organoids (P = 0.044; Fig. 4f,g) from patients with AD. Analysis of available cerebrospinal fluid (CSF) biomarker GWAS data32 showed that protective EPHX2 rs751141 variant is nominally associated with lower pTau levels in individuals with abnormal amyloid levels (P = 0.034; Supplementary Fig. 13), whereas no association was observed in those with normal amyloid levels (P = 0.69).
Next, we performed a prime editing experiment33 to test loss-of-function effect in three replicates of iPS cell-derived neurons from patients with AD. Prime editing was used to edit EPHX2 rs751141 from G (Arg [CGG]) to A (Gln [CAG]) in the iPS cell genome of a patient with AD. We selected single colonies for each mutagenesis line and validated with Sanger sequencing (Fig. 4h). The G to A mutation significantly reduced EPHX2 protein levels in iPS cell-derived neurons of a patient with AD (Fig. 4h). Compared to wild-type lines (EPHX2 G/G), the EPHX2 A/A mutation increased neuronal differentiation and survival pathways (Fig. 4i,j). Notably, the EPHX2 A/A mutation activated the PI3K–Akt pathway, which inhibits GSK-3β, a major tau kinase, consistent with reduced pTau by EPHX2–p.Arg287Gln mutation (Fig. 4f). In summary, these functional observations indicate that EPHX2 is a likely causal gene for AD, and that the protective mutation p.Arg287Gln is associated with reduced pTau levels and neuroprotection in AD.
Pharmacological EPHX2 inhibition reduces pro-inflammatory metabolites and improves cognition in 5xFAD mice
We next tested whether pharmacological inhibition of EPHX2 has a beneficial effect in 5xFAD mice (Fig. 5). Specifically, we evaluated the effects of EC5026 (a picomolar EPHX2 inhibitor in phase I trials; ClinicalTrials.gov IDs: NCT06438471, NCT04228302 and NCT04908995) (Fig. 5a). We observed that EC5026 treatment significantly reduced amyloid-β pathology (Fig. 5b,d) and microglia-associated inflammation (Fig. 5c,d) while enhancing lysosomal function (Extended Data Fig. 5a). Single-cell analysis further revealed that EC5026 blocked multiple pro-inflammatory pathways in microglia (Fig. 5h,i and Extended Data Fig. 5b) and enhanced neuronal synapse pathways in excitatory neurons and oligodendrocytes (Extended Data Fig. 5c), consistent with findings from patient iPS cell-derived neurons (Fig. 4i,j).
We also evaluated the effects of EPHX2 inhibition on learning and hippocampal-dependent short-term and long-term memory. The novel object recognition test showed that EC5026 treatment significantly improved long-term recognition memory compared to vehicle-treated 5xFAD mice (P = 0.014; Fig. 5e) at 9 months. EC5026-treated mice also showed improved contextual fear memory compared to vehicle-treated groups (P = 0.033; Fig. 5f). In the Morris water maze, mice treated with EC5026 showed significantly reduced escape latency on training day 5 compared to the vehicle-treated group (P = 0.004; Fig. 5g) and increased time in target quadrant (P = 0.048). Taken together, pharmacologic inhibition of EPHX2 by EC5026 protected 5xFAD mice.
We next performed pharmacokinetic and brain target engagement analyses of EC5026 in 5xFAD mice. EC5026 achieved therapeutic concentrations in cortical regions 2 h after dosing with approximately 15% brain penetration (Extended Data Fig. 6a,b), and liquid chromatography–tandem mass spectrometry analysis confirmed on-target EPHX2 enzyme inhibition with reduced cortical and plasma levels of EPHX2 enzymatic products, including DiHETrE and DiHDPE (Fig. 5j and Extended Data Fig. 6c). Importantly, metabolomic analysis from the Emory Healthy Brain Study34 in CSF and plasma of patients with AD revealed elevated levels of 11,12-DiHETrE and 14,15-DiHETrE compared to cognitively normal controls. EC5026 treatment in 5xFAD mice reduced the level of 11,12-DiHETrE and 14,15-DiHETrE (Fig. 5j) in plasma, demonstrating that pharmacological EPHX2 inhibition reverses the aberrant epoxyeicosatrienoic acid metabolism observed in human AD. In addition, phenome-wide association studies35 from the UK Biobank cohort36 suggested no significant association for EPHX2 IV across 624 other human disease phenotypes (Supplementary Fig. 14), indicating no deleterious effects associated with these two EPHX2 IVs. In conclusion, we identified EPHX2 as a genetically indicated and experimentally validated potent anti-inflammatory target for AD.
Population-based validation of alzMR-score-prioritized drug targets
We conducted DWASs to further test MR-supported repurposable drugs for AD from 111,680 patients with MCI (Supplementary Table 12; Methods). To maintain statistical power, we evaluated 210 frequently prescribed drugs using four modified time-to-event regression complementary models: (1) exposed versus non-exposed model (EXP); (2) absolute higher exposed versus low exposed (Abs); (3) relatively high exposed versus low exposed (Rel); and (4) medication possession ratio (MPR). We adjusted all analyses for age, sex, race and common AD-related comorbidities and found that the percentage of significant drugs (FDR < 0.05 and hazard ratio (HR) < 1) was 7% (n = 14) by MPR, 9.5% (n = 20) by Abs, 19% (n = 40) by Rel and 20 % (n = 43) by EXP (Fig. 6a).
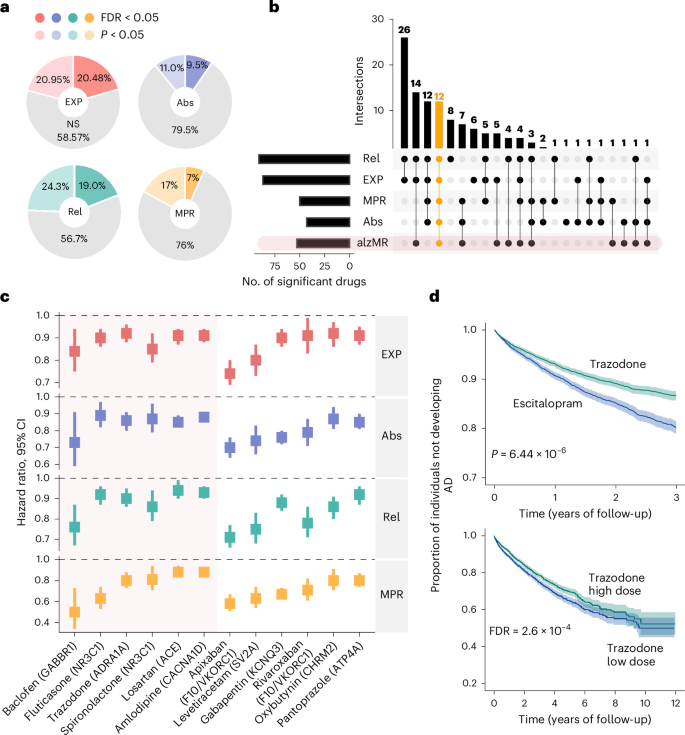
a, The percentage of significant drugs was evaluated by four pharmacoepidemiologic methods used in DWAS: exposed versus non-exposed (EXP), higher versus low absolute exposure (Abs), high versus low relative exposure (Rel) and MPR. b, The upset plot showing the intersections of significant drugs across the four DWAS models and MR analysis. c, DWAS identified 12 potential repurposable drugs for AD. HRs for AD were estimated using Cox proportional hazards regression across 111,680 patients with MCI. Squares show the HR point estimate and vertical whiskers show the 95% CI. The light-red background highlights targets supported by MR evidence at an FDR < 0.05. d, The curve displays the proportion of individuals who did not develop AD in the MCI population. Top: trazodone versus the comparator drug escitalopram in a target trial emulation analysis (n = 59,920). Bottom: high-dose trazodone versus low-dose trazodone exposure groups (n = 11,532). Non-exposure drug cohorts were matched to the exposures by adjusting age, sex, race, disease comorbidities and other confounding factors (Methods). Solid lines show the estimated AD-free probability; shaded bands indicate the 95% CI. P values were calculated using a two-sided log-rank test.
Among all significant drugs, 12 were significantly associated with reduced AD risk across all four DWAS models at an FDR < 0.05 (Fig. 6b,c). Their targets also showed significant alzMR score (Figs. 2 and 6b,c). Six drugs (50%) had significant alzMR scores (FDR < 0.05) on their primary targets, such as trazodone (ADRA1A inhibitor), losartan (acting on ACE), baclofen (GABBR1 agonist), fluticasone and spironolactone (NR3C1 agonist) and amlodipine (CACNA1D inhibitor) (Fig. 6c). Specifically, amlodipine (CACNA1D inhibitor (alzMR score = 11.4)) was significantly associated with 12% reduced risk of AD in patients with MCI (HR = 0.88; 95% confidence interval (CI) 0.85–0.91; FDR = 3.6 × 10⁻¹⁰; Extended Data Fig. 7). Trazodone (ADRA1A antagonist; alzMR score = 35.7) is significantly associated with 14% reduced risk of AD in patients with MCI (HR = 0.86; 95% CI 0.80–0.91; FDR = 2.6 × 10⁻⁴) in a dose-dependent manner (Fig. 6d and Supplementary Table 13). Additionally, trazodone was significantly associated with 22% reduced AD risk compared to an active comparator drug of escitalopram from another independent MarketScan Claim database (Methods; HR = 0.78; P = 6.44 × 10⁻⁶; Fig. 6d and Supplementary Table 14). In summary, these real-world patient data analyses further support alzMR-score-prioritized targets.
AD target discovery for individuals with AA
Individuals with AA and EA differ in disease prevalence, risk factors and clinical course of AD37. Fewer clinical trials have enrolled AA, and race-specific drug responses for AD are largely unknown38. We conducted drug–target MR analysis in AA (Figs. 2 and 7). We identified seven suggestive druggable targets that showed consistent direction of alzMR scores with the experimentally reported MoA of corresponding drugs (P < 0.05; Fig. 7, Supplementary Table 8 and Supplementary Fig. 15). ALDH2 showed consistently significant MR results in an AA-specific eQTL dataset from MetaBrain15 (Supplementary Fig. 16). The MoAs of DHFR, SLC7A11, ALDH2 and PPARG (57%) reside in metabolism pathways (Fig. 7b and Supplementary Fig. 7b). The major function of PPARG is to regulate fatty acid storage and glucose metabolism39, and elevated blood glucose increases the risk of dementia in AA, but not EA, with diabetes40.
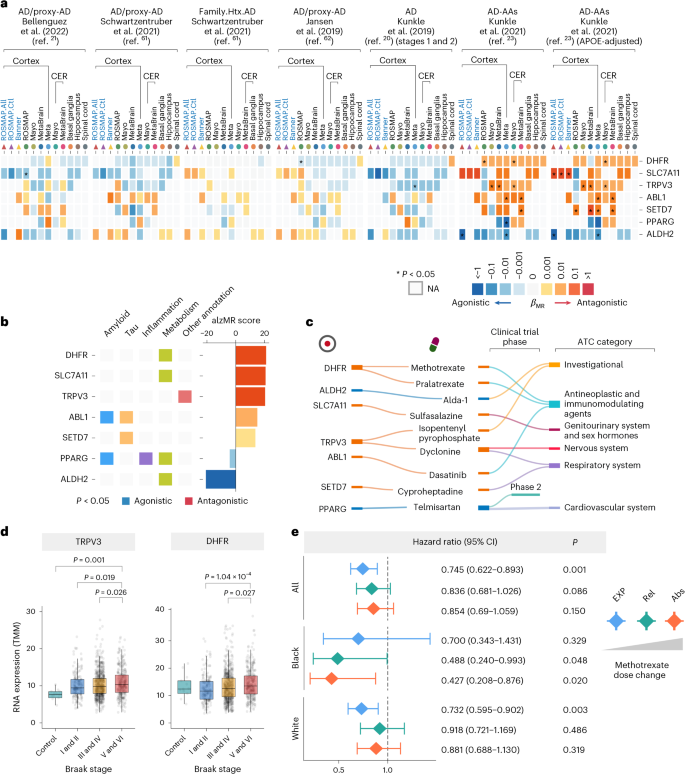
a, Heat map showing the βMR for seven suggestive drug targets for AA20,21,23,60,61,62. βMR coefficient > 0 indicates antagonistic targets; β coefficient < 0 indicates agonistic targets. NA, not available for MR analysis due to the lack of valid instrumental variables. b, Distribution of AA-specific drug targets across MoA categories. Left: five MoA categories of AD: amyloid, tau, inflammation, metabolism and others. Right: bar plot of alzMR score for each drug target. c, Sankey plot shows the relationship between repurposed drugs and alzMR score-predicted targets for AD. The dark blue color denotes that the drug is an agonist for the target; the red color denotes that the drug is an antagonist/inhibitor for the target. d, The relationship of TRPV3 and DHFR expression with four Braak stages (control: n = 12; Braak I–II: n = 173; Braak III–IV: n = 635; Braak V–VI: n = 287). Box-plot elements similar to those presented in Fig. 4c; dots are RNA expression level for individuals. Two-sided Mann–Whitney U-test was performed for statistical analysis at P < 0.05. TMM, trimmed mean of M-values normalization. e, HRs indicate methotrexate dose-dependent effect in AD with AA. HRs were estimated using Cox proportional hazards regression under three DWAS exposure models with gradually increasing drug dose (Methods): exposed versus non-exposed model (EXP; all; n = 2,402; black n = 246; white n = 1,700), high versus low relative exposure (Rel; all; n = 1,800; black n = 190; white n = 1,286) and higher versus low absolute exposure (Abs; all; n = 1,674; black n = 176; white n = 1,200). Diamonds show the HR point estimate; horizontal whiskers show the 95% CI; dashed line marks the null (HR = 1). P values are two-sided, from a Wald test of log-HR in the Cox model.
For AA MR analysis, TRPV3 exhibited a stronger alzMR score (20.4; P < 0.05), and we detected elevated expression of TRPV3 in the human brain in the Genotype-Tissue Expression41 database (Supplementary Fig. 17). TRPV3 expression in the human cortex was significantly upregulated in the late Braak stages (V–VI) compared to the early Braak stages (P = 0.019) and mid-Braak stages (P = 0.026; Fig. 7d). Elevated TRPV3 expression was also observed across the severity of clinical cognitive diagnosis score (Supplementary Fig. 18). Dyclonine42, a preclinical TRPV3 inhibitor (Fig. 7c), has been reported to help mitigate mitochondrial dysfunction43.
Dihydrofolate reductase (encoded by DHFR) displayed the strongest alzMR score for AA (Fig. 7b). We found that DHFR expression in the human cortex was significantly increased in the late Braak stages compared to the early Braak stages (P = 1.04 × 10⁻⁴) and mid-Braak stages (P = 0.027) (Fig. 7d). Elevated DHFR expression was also observed across the severity of cognitive impairment (Supplementary Fig. 18) compared to MCI (P = 0.003) and non-cognitive impairment groups (P = 1.35 × 10⁻⁴). Real-world patient data analysis suggests that methotrexate, an FDA-approved DHFR inhibitor, was significantly associated with reduced AD risk in AA, but not EA, with MCI (Fig. 7c,e and Supplementary Table 15) in a dose-dependent manner (Fig. 7e). In summary, these MR observations suggest AA-specific candidate targets validated by real-world patient data.
Source: www.nature.com