




In-brief analysis
Oct 7, 2026
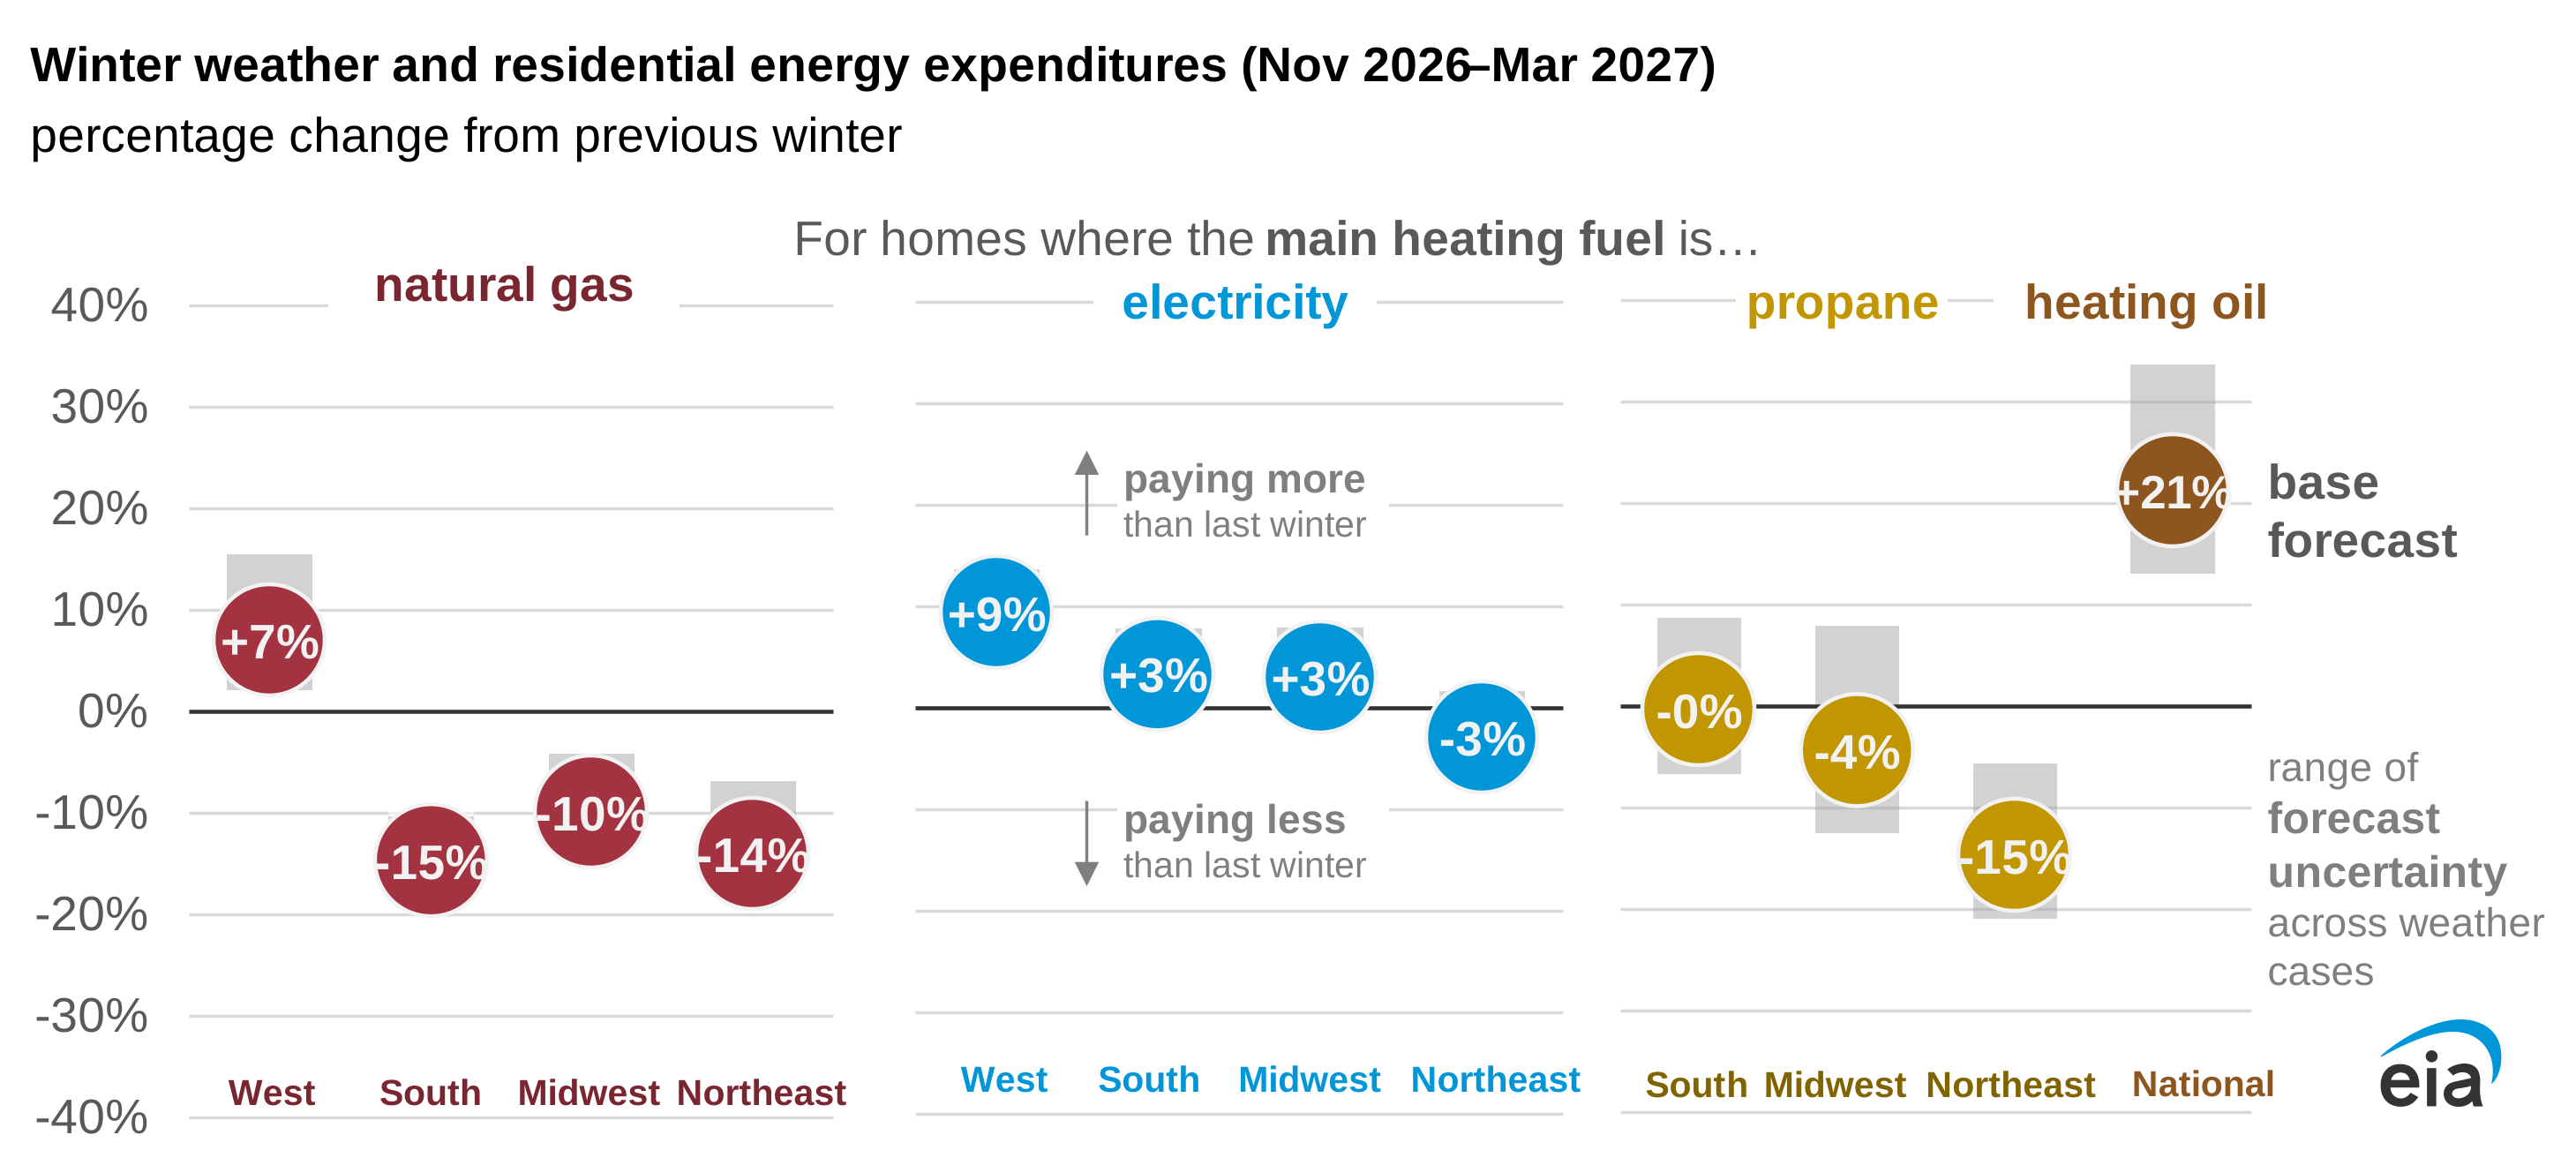
We expect energy expenditures this winter to vary because of diverging trends in energy prices among fuels and regional variation in forecast temperatures. We expect that lower prices for natural gas and propane will drive decreases in expenditures this year for the half of U.S. households heating with those fuels. Higher prices for electricity and heating oil drive increased expenditures for households heating with those fuels in our forecast.
In-brief analysis
Oct 5, 2026
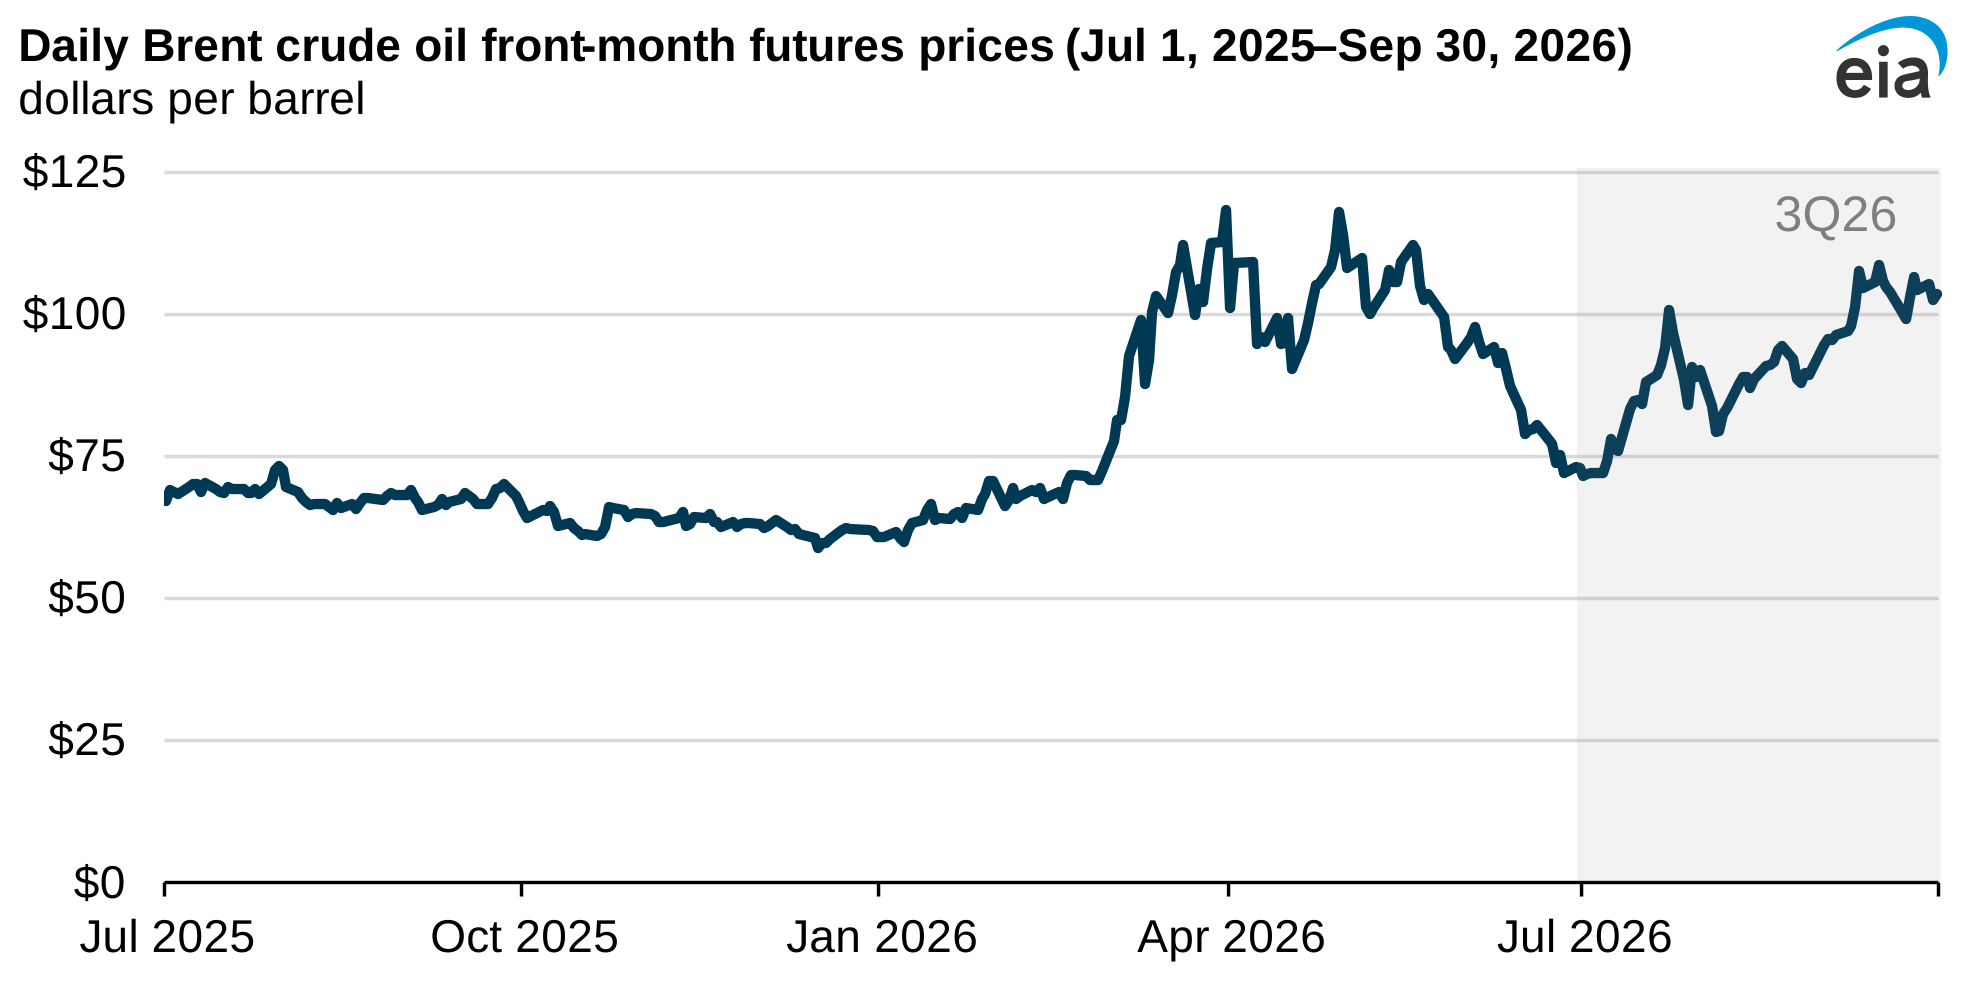
Data source: Bloomberg L.P.
Note: 3Q26=third quarter of 2026
Petroleum markets in the third quarter of 2026 (3Q26) were characterized by increasing prices for crude oil and petroleum products amid persistent conflict in the Middle East.
In-brief analysis
Oct 2, 2026
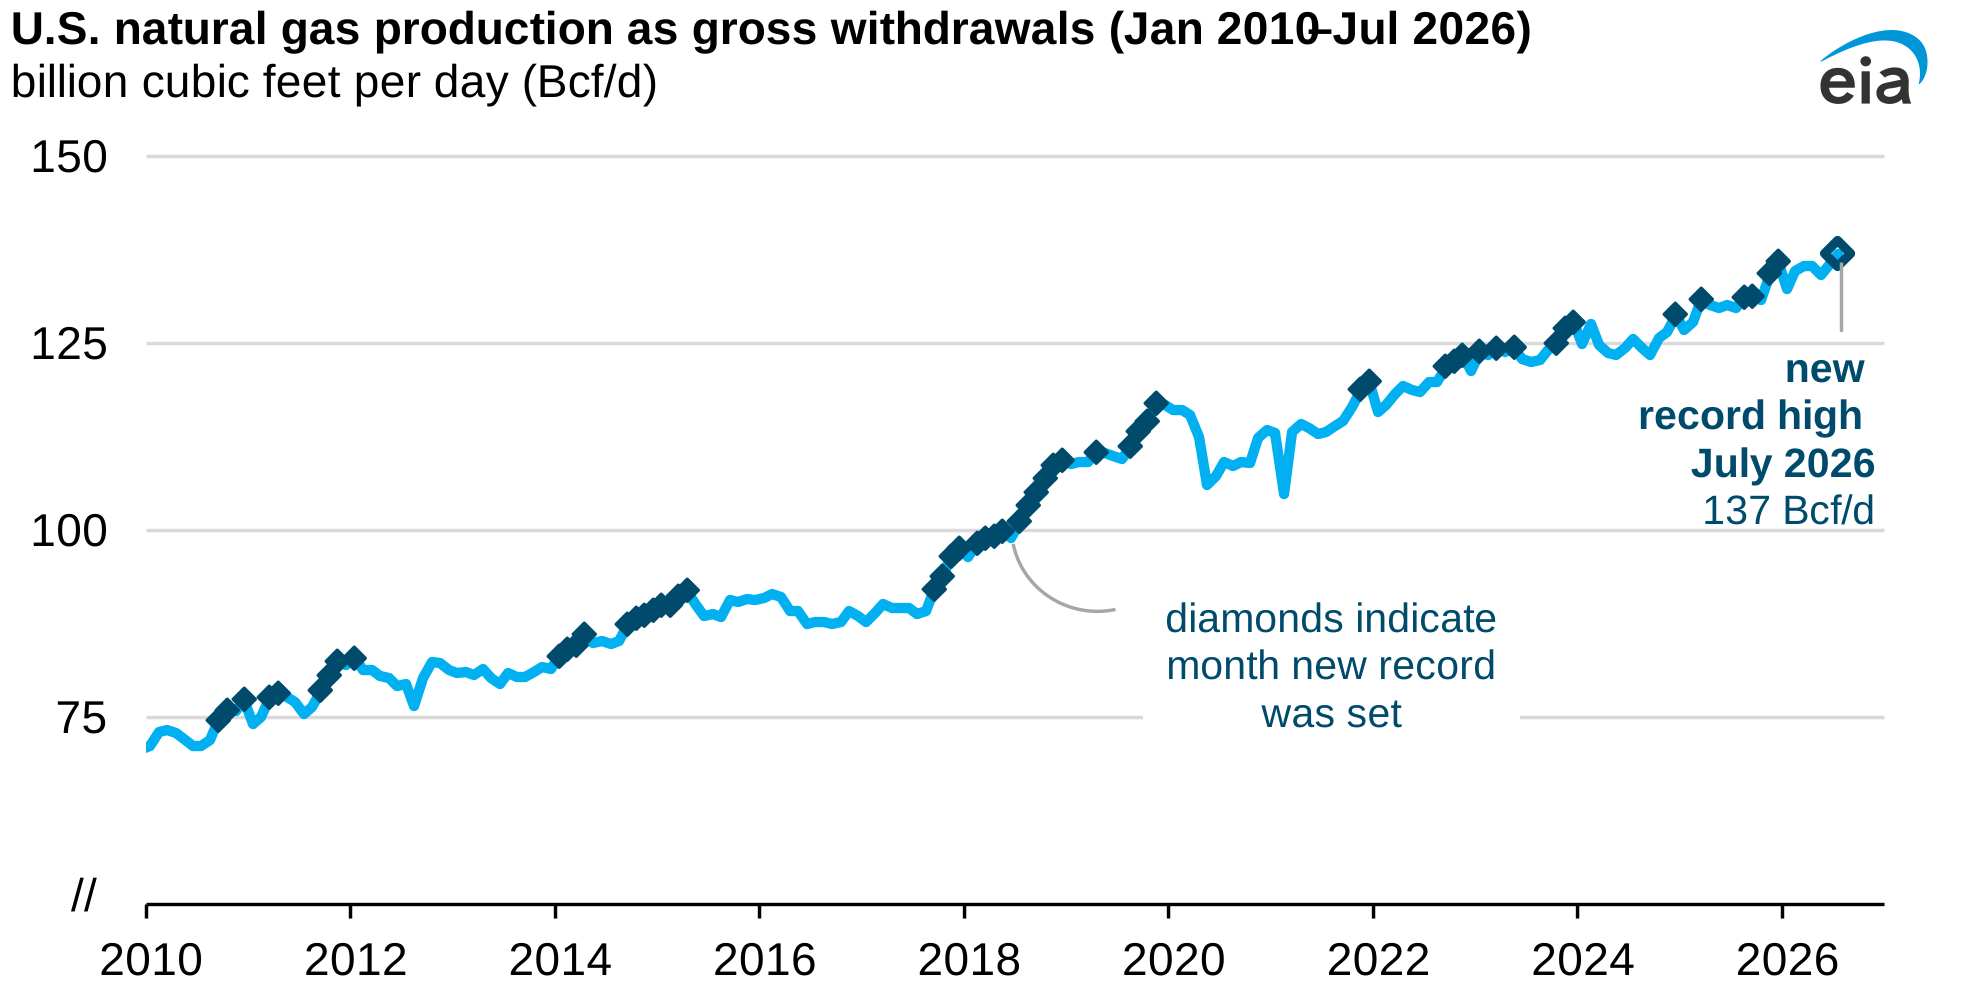
U.S. natural gas production hit an all-time high in July 2026, driven primarily by increased output in the Permian Basin, according to our latest Natural Gas Monthly.
In-brief analysis
Oct 1, 2026
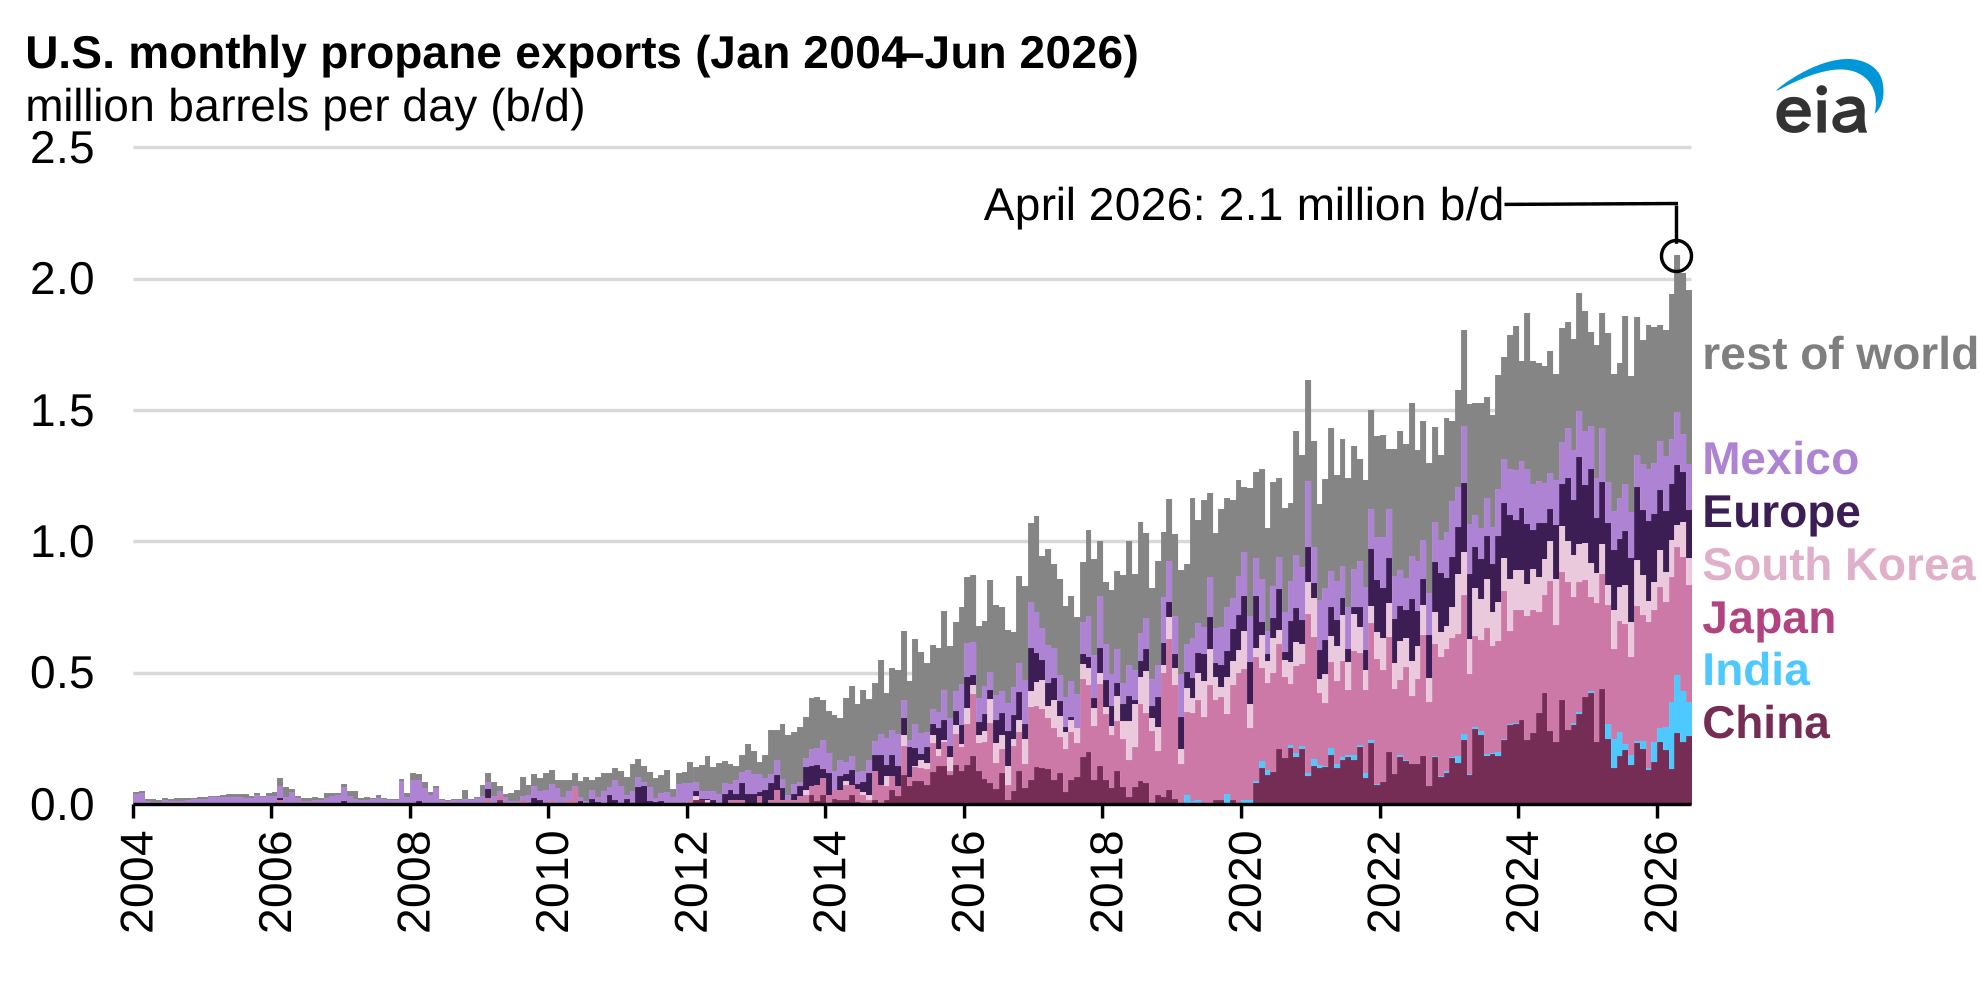
U.S. propane exports increased to 2 million barrels per day (b/d) in the first half of 2026, 11% more than during the same period in 2025. Increased U.S. propane production and changing trade flows, particularly increased exports to India and other countries in South Asia, drove propane exports to a record high of 2.1 million b/d in April 2026. Since then, total propane exports, including exports to India, have continued at levels well above the five-year average.
In-brief analysis
Sep 30, 2026
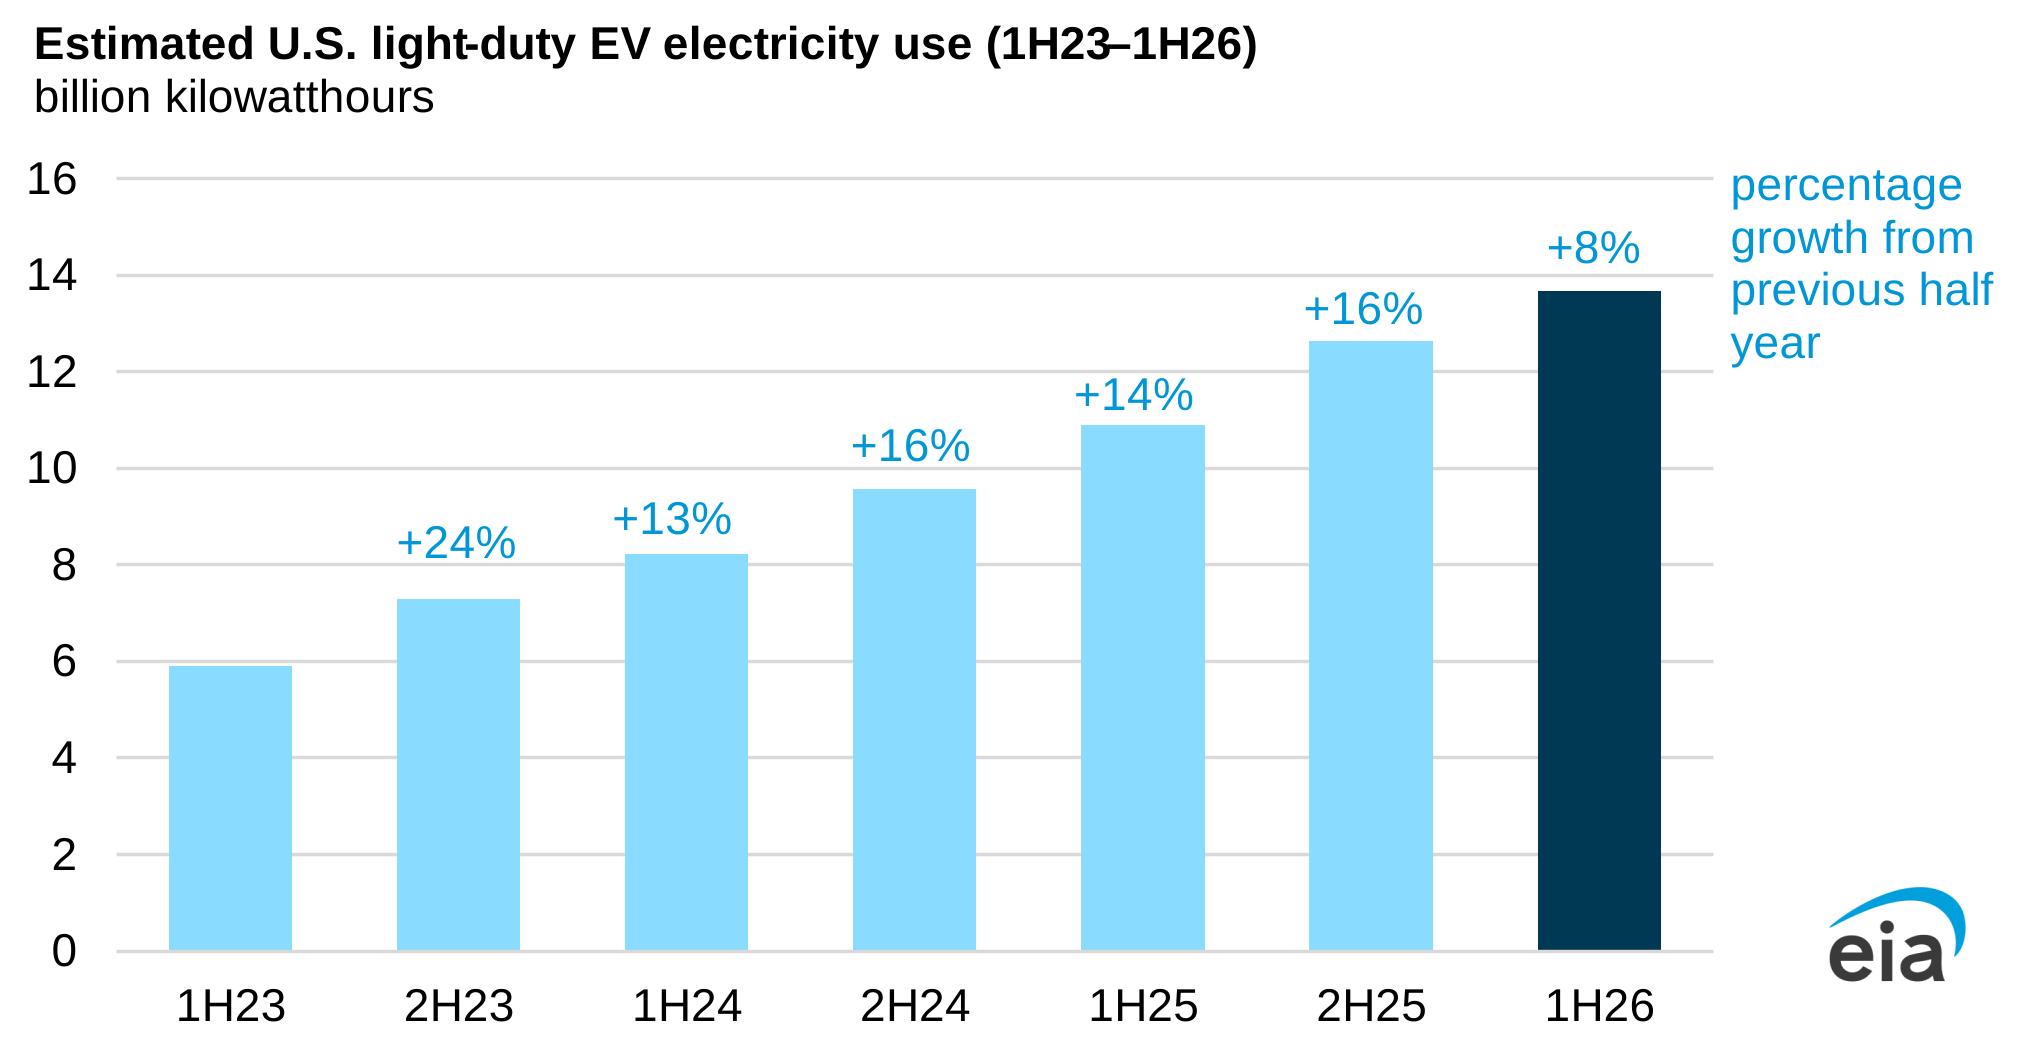
We estimate light-duty electric vehicles in the United States consumed 8% more electricity during the first six months of 2026 than in the last half of 2025 (2H25) in our Monthly Energy Reviewdown from the 13–24% growth seen in six-month periods in recent years. The slowing electric vehicle electricity consumption growth followed a decline in sales after U.S. federal tax credits expired in September 2025. Overall, U.S. light-duty electric vehicle electricity use has more than doubled since 1H23, totaling nearly 14 billion kilowatthours in 1H26.
In-brief analysis
Sep 25, 2026
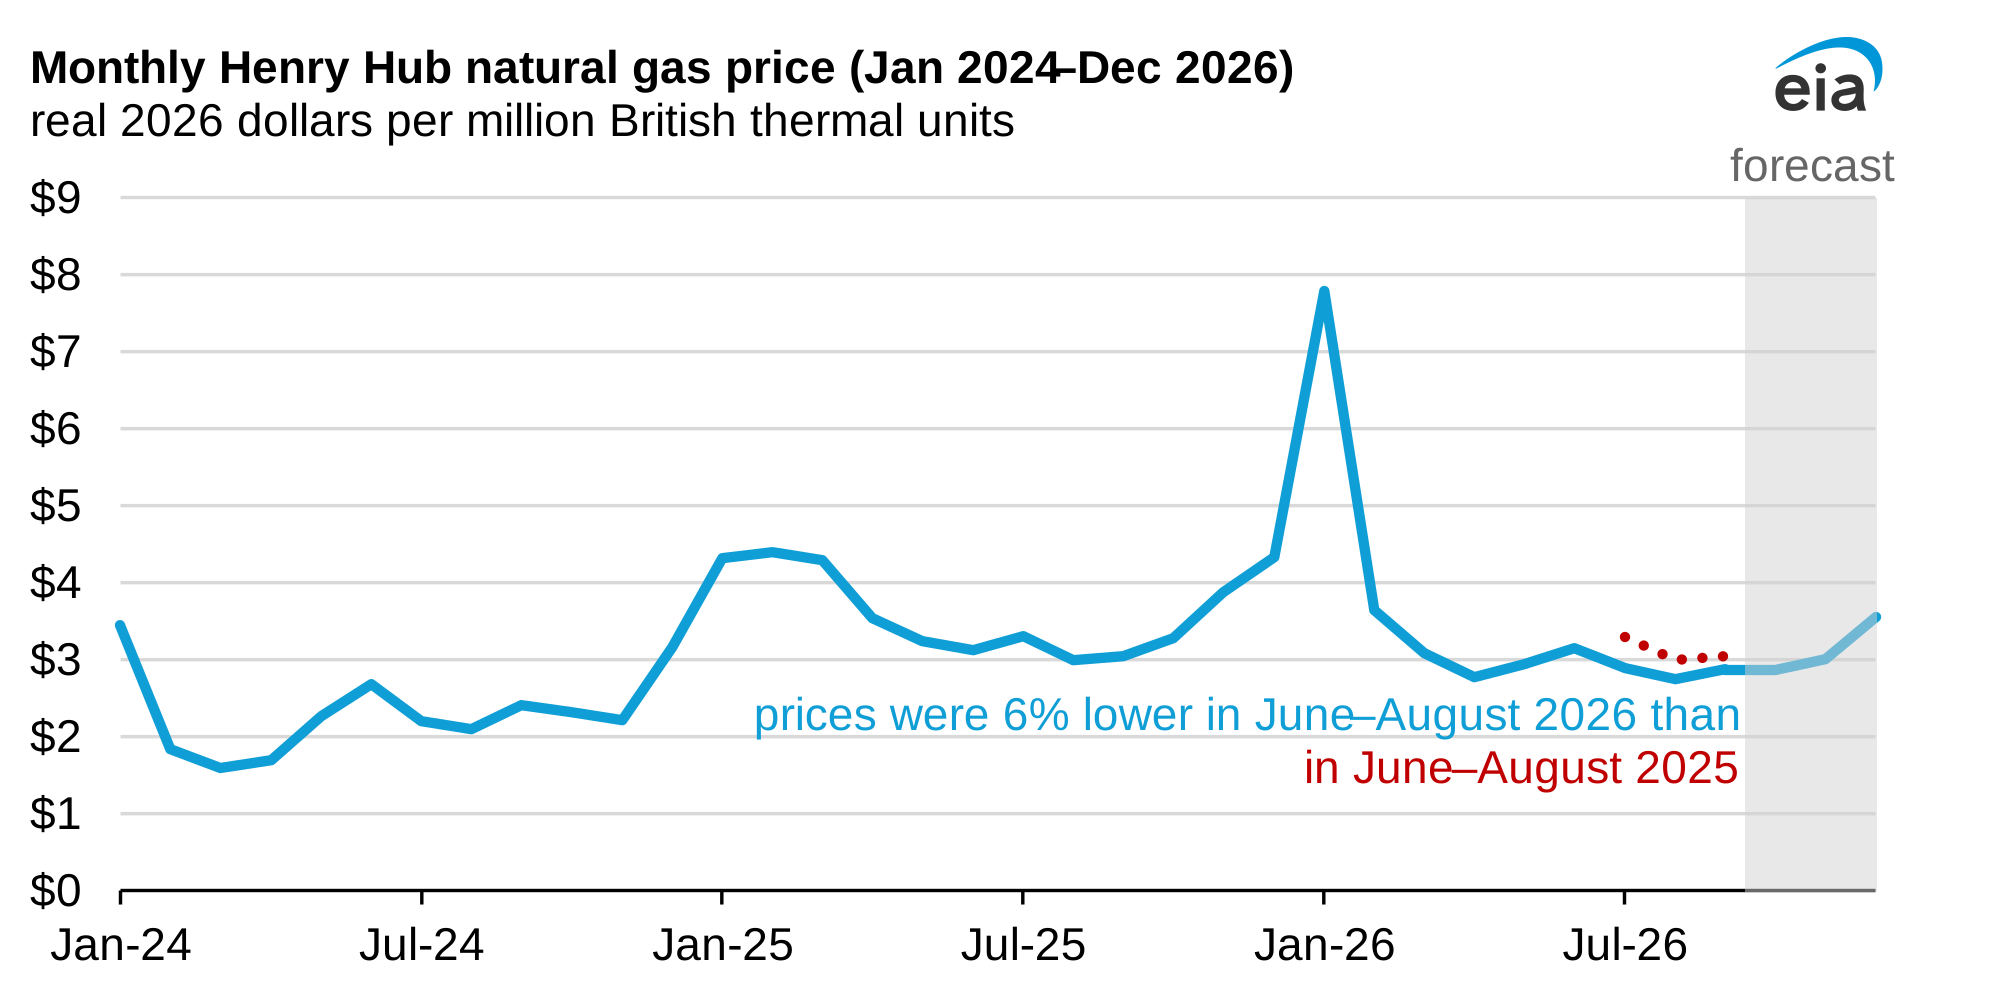
The Henry Hub natural gas spot price averaged $2.93 per million British thermal units from June through August, 6% less than the same period last year. Prices were lower this summer despite exceptionally hot weather that increased electricity demand for air conditioning. Natural gas-fired power plants often help meet higher demand during such periods.
In-brief analysis
Sep 22, 2026
This article has been reposted to correct a data point related to production per well.
Data source: Enverus
Note: Crude oil and natural gas production in barrels of oil equivalent
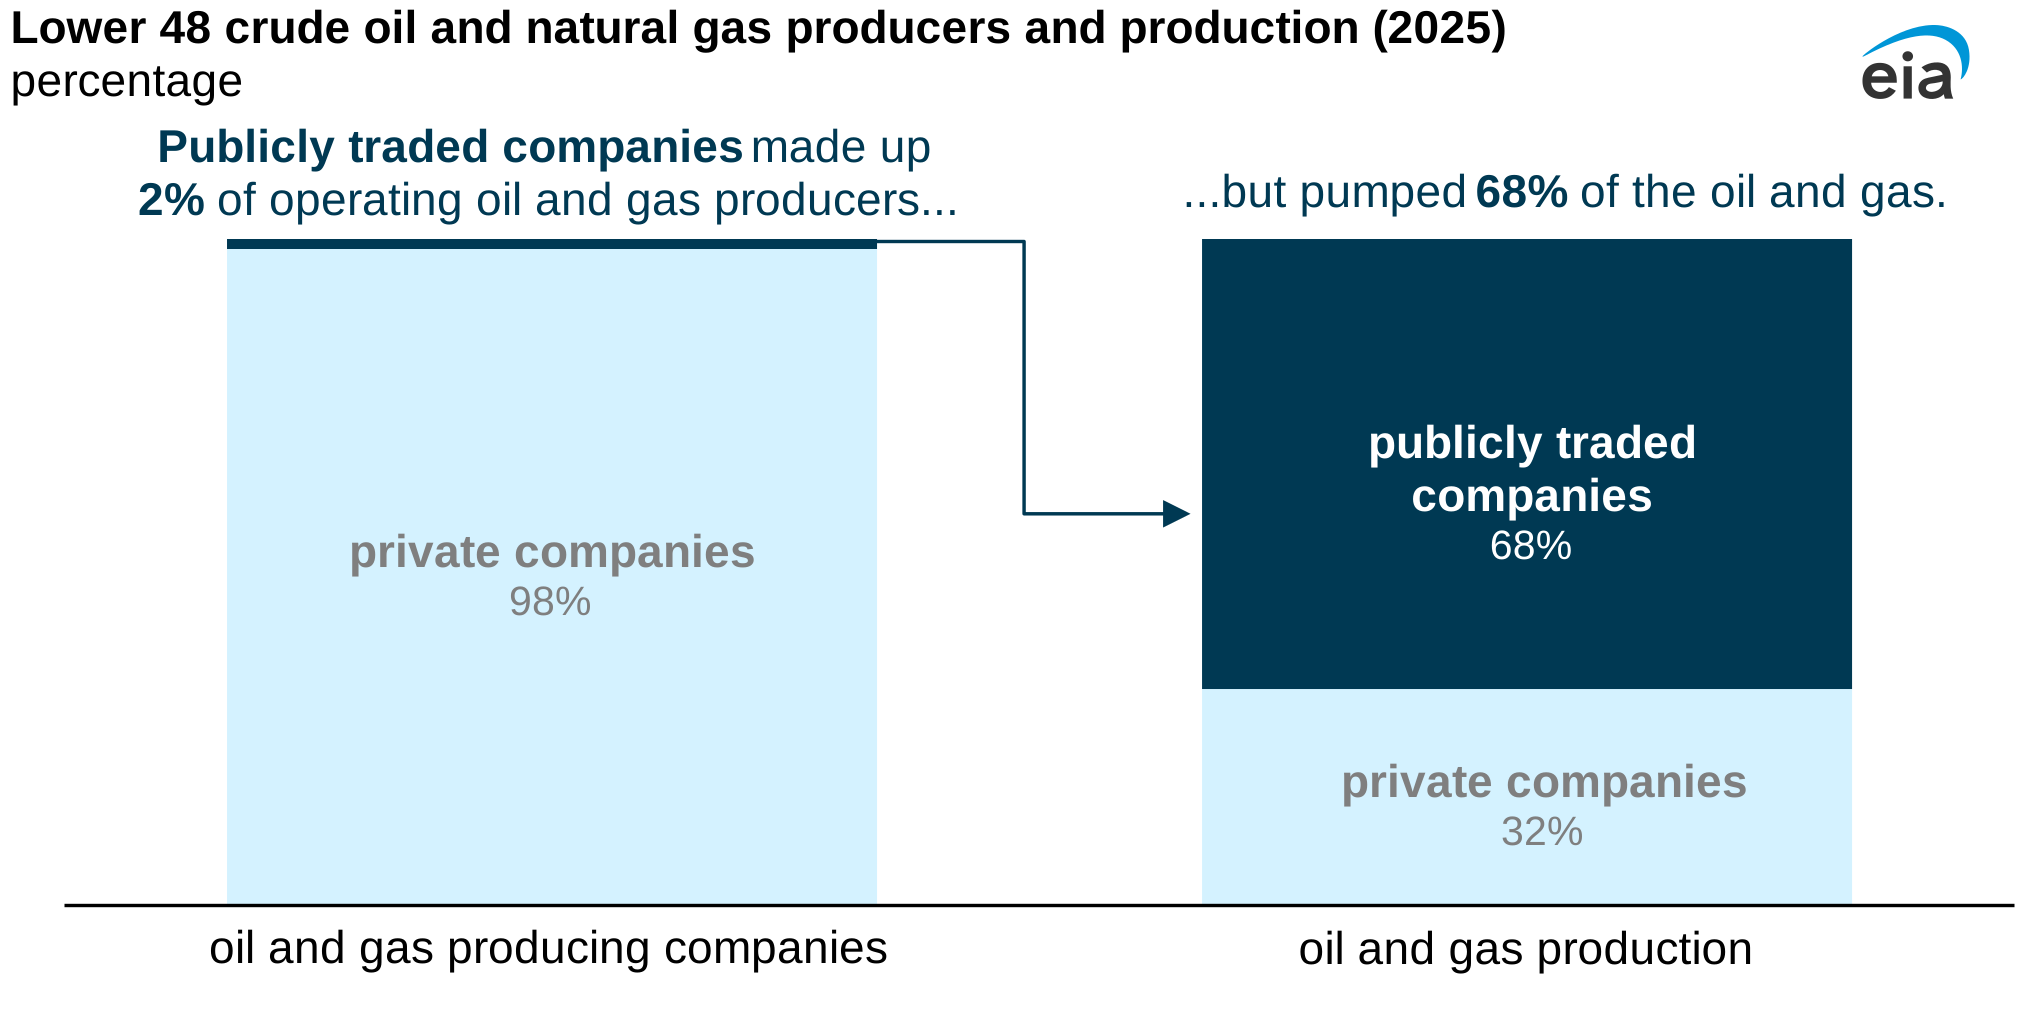
Publicly traded companies represent a tiny share of the total number of companies producing crude oil and natural gas in the United States, but they make up a large share of U.S. production. In 2025, publicly traded companies accounted for just 2% of about 12,000 oil and natural gas producers but produced 68% of the crude oil and natural gas in the Lower 48 states.
In-brief analysis
Sep 18, 2026
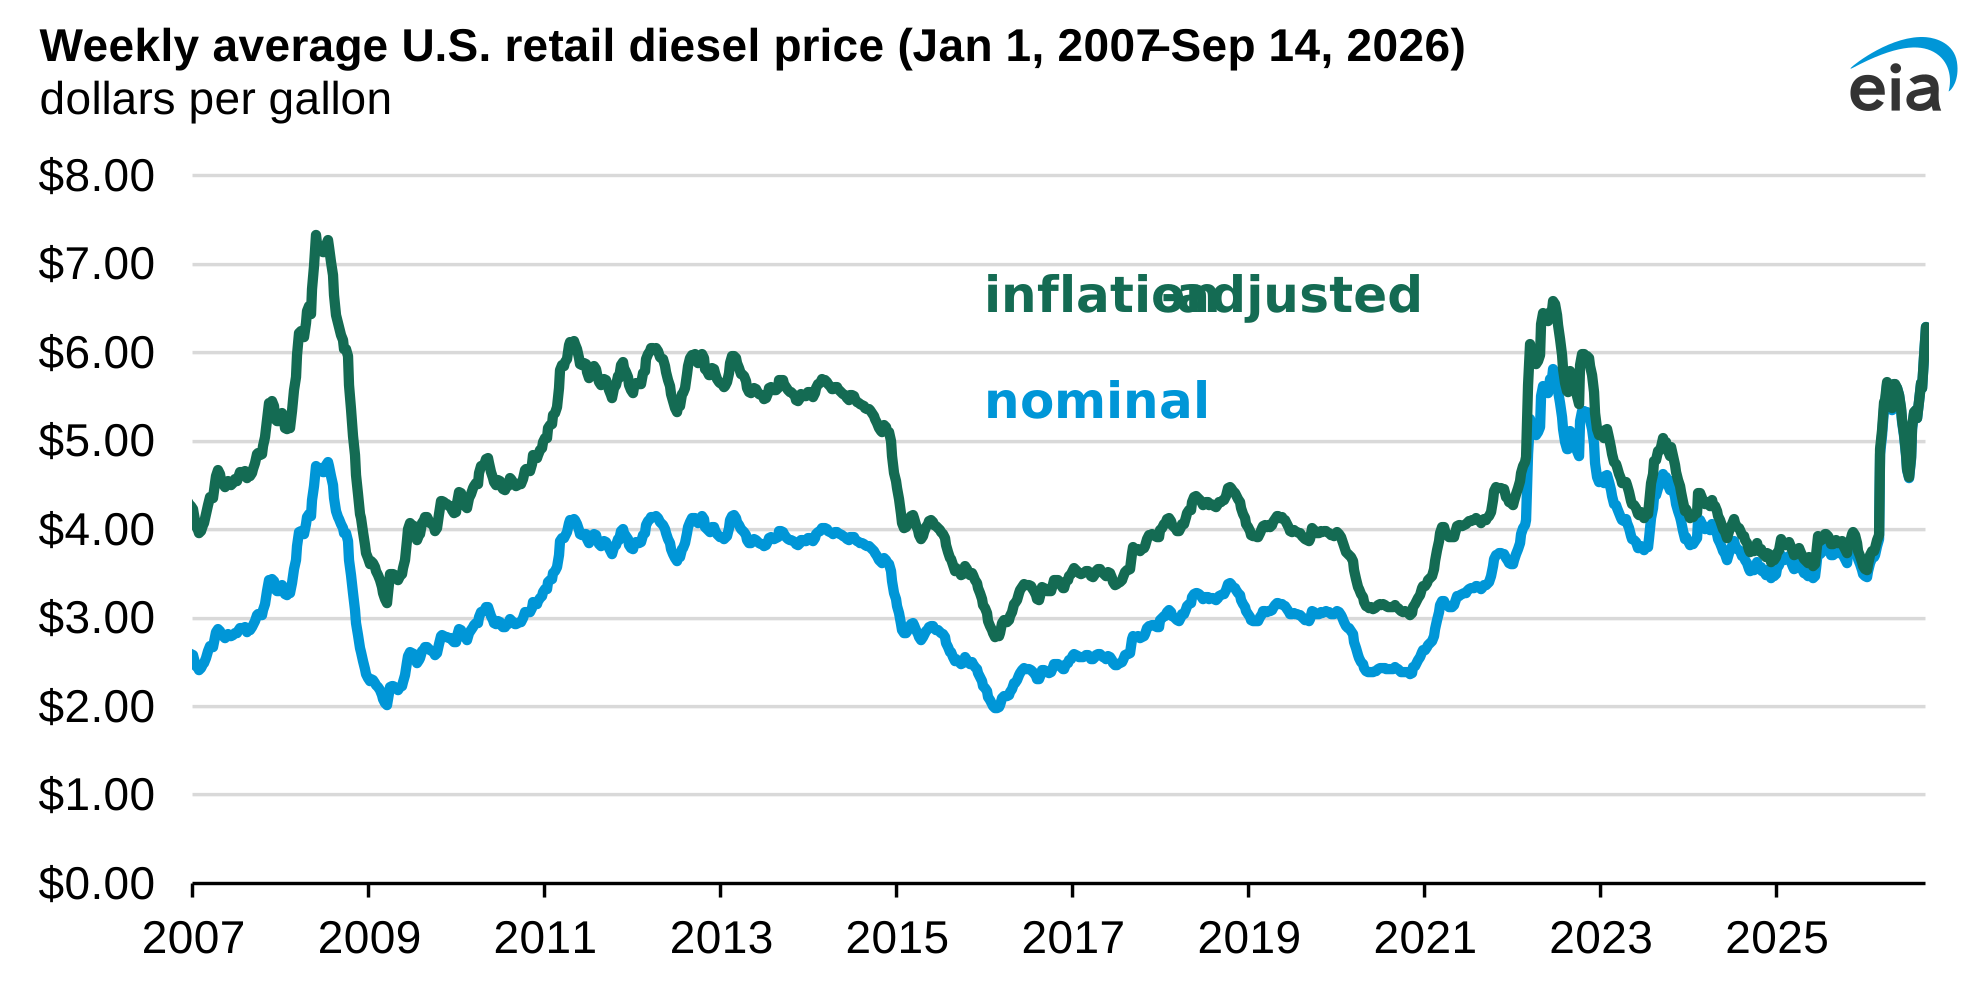
The price of distillate fuel oil, often sold as diesel, is driven by the price of crude oil, retail margins, distribution costs, taxes, and crack spreads, the indicator we use for refining margins. Tight global supplies of distillate fuel oil and elevated crude oil prices have driven prices higher in recent months.
In-brief analysis
Sep 15, 2026
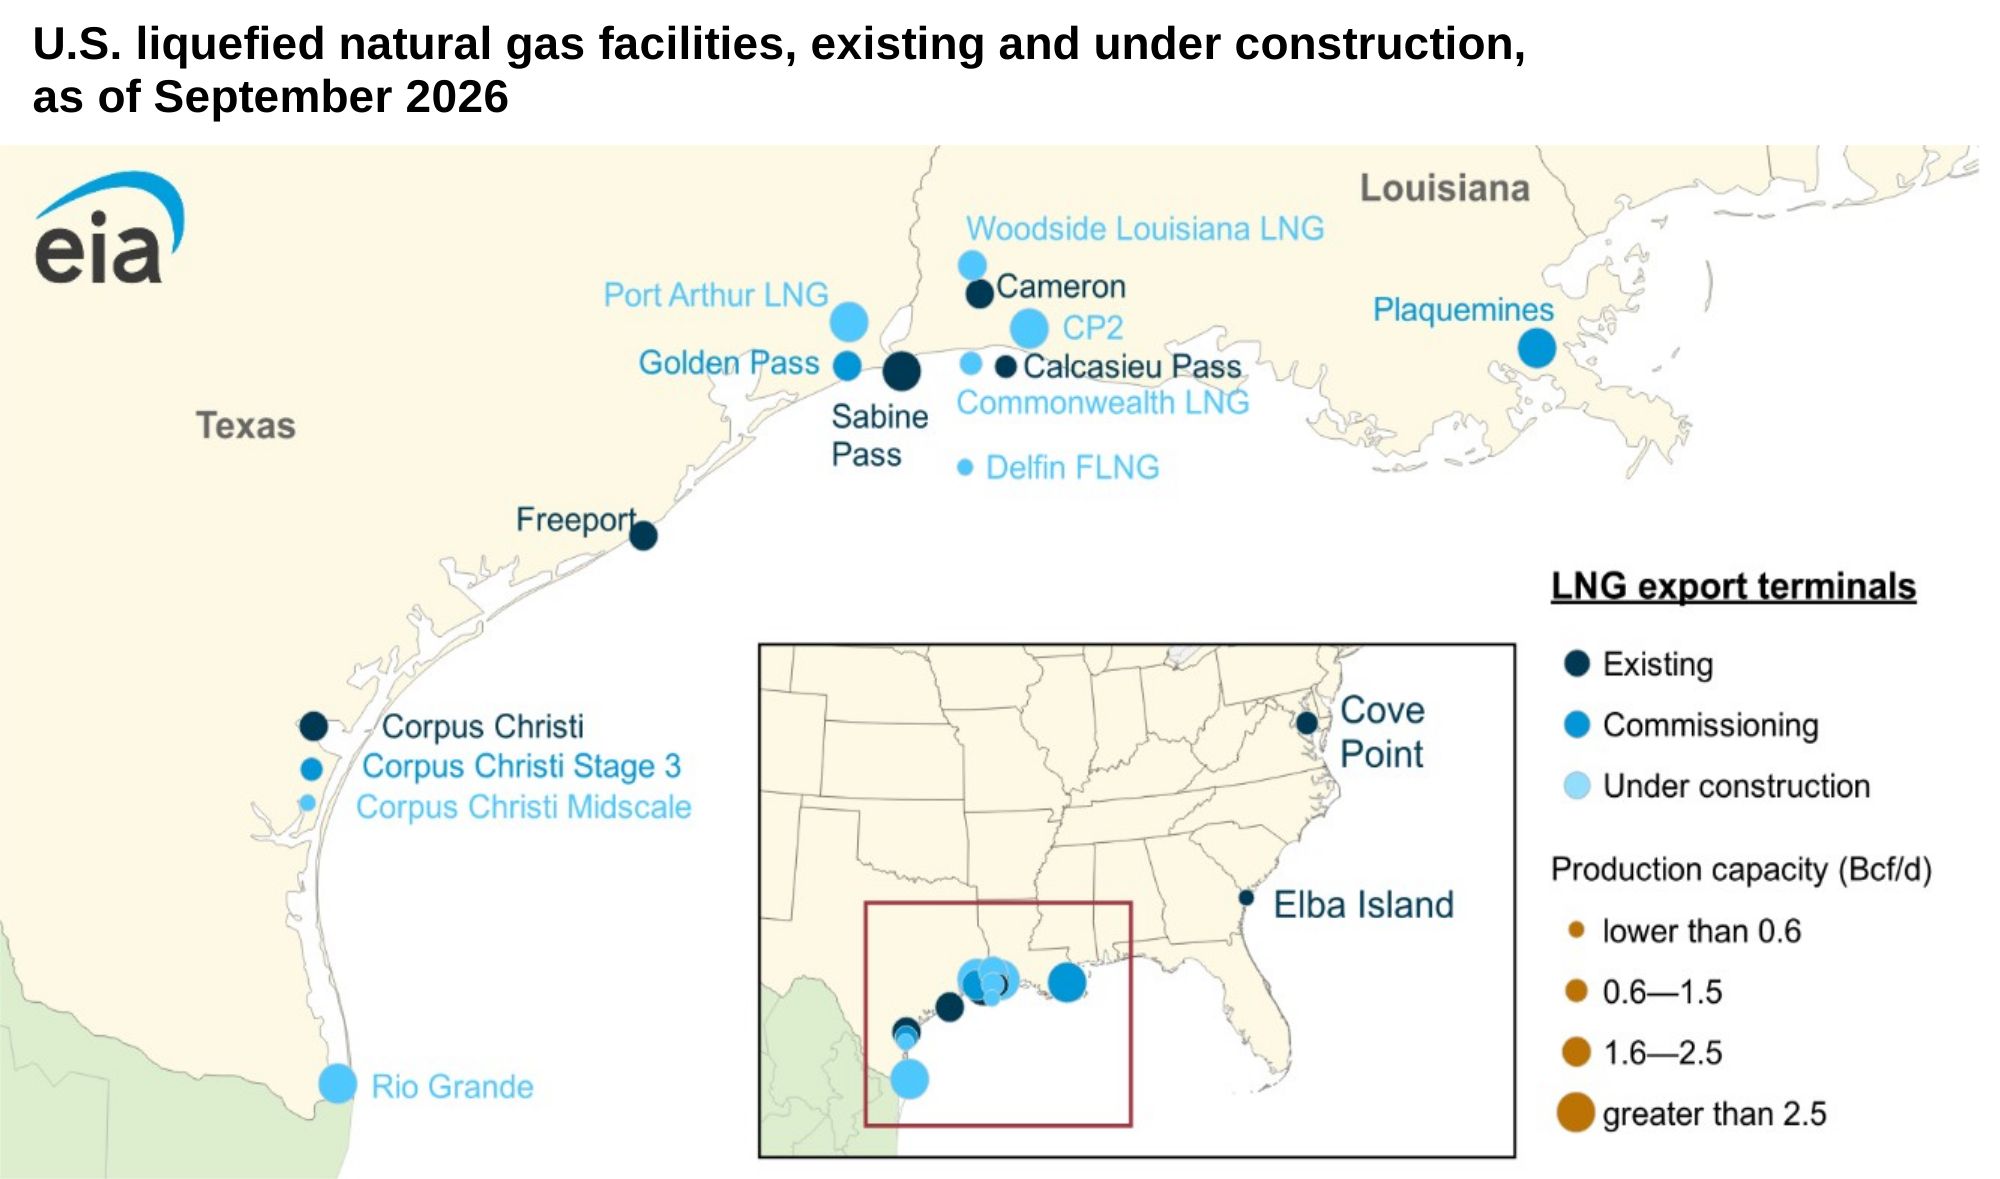
Data source: U.S. Energy Information Administration, Liquefaction Capacity File
Note: LNG=liquefied natural gas; FLNG=Floating Liquefied Natural Gas
On August 28, 2026, Cheniere Energy, Inc., completed its Corpus Christi Liquefaction Stage 3 Project (CCL Stage 3) in Texas, taking custody and control of the seventh and last liquefied natural gas (LNG) train in the project.
In-brief analysis
Sep 10, 2026
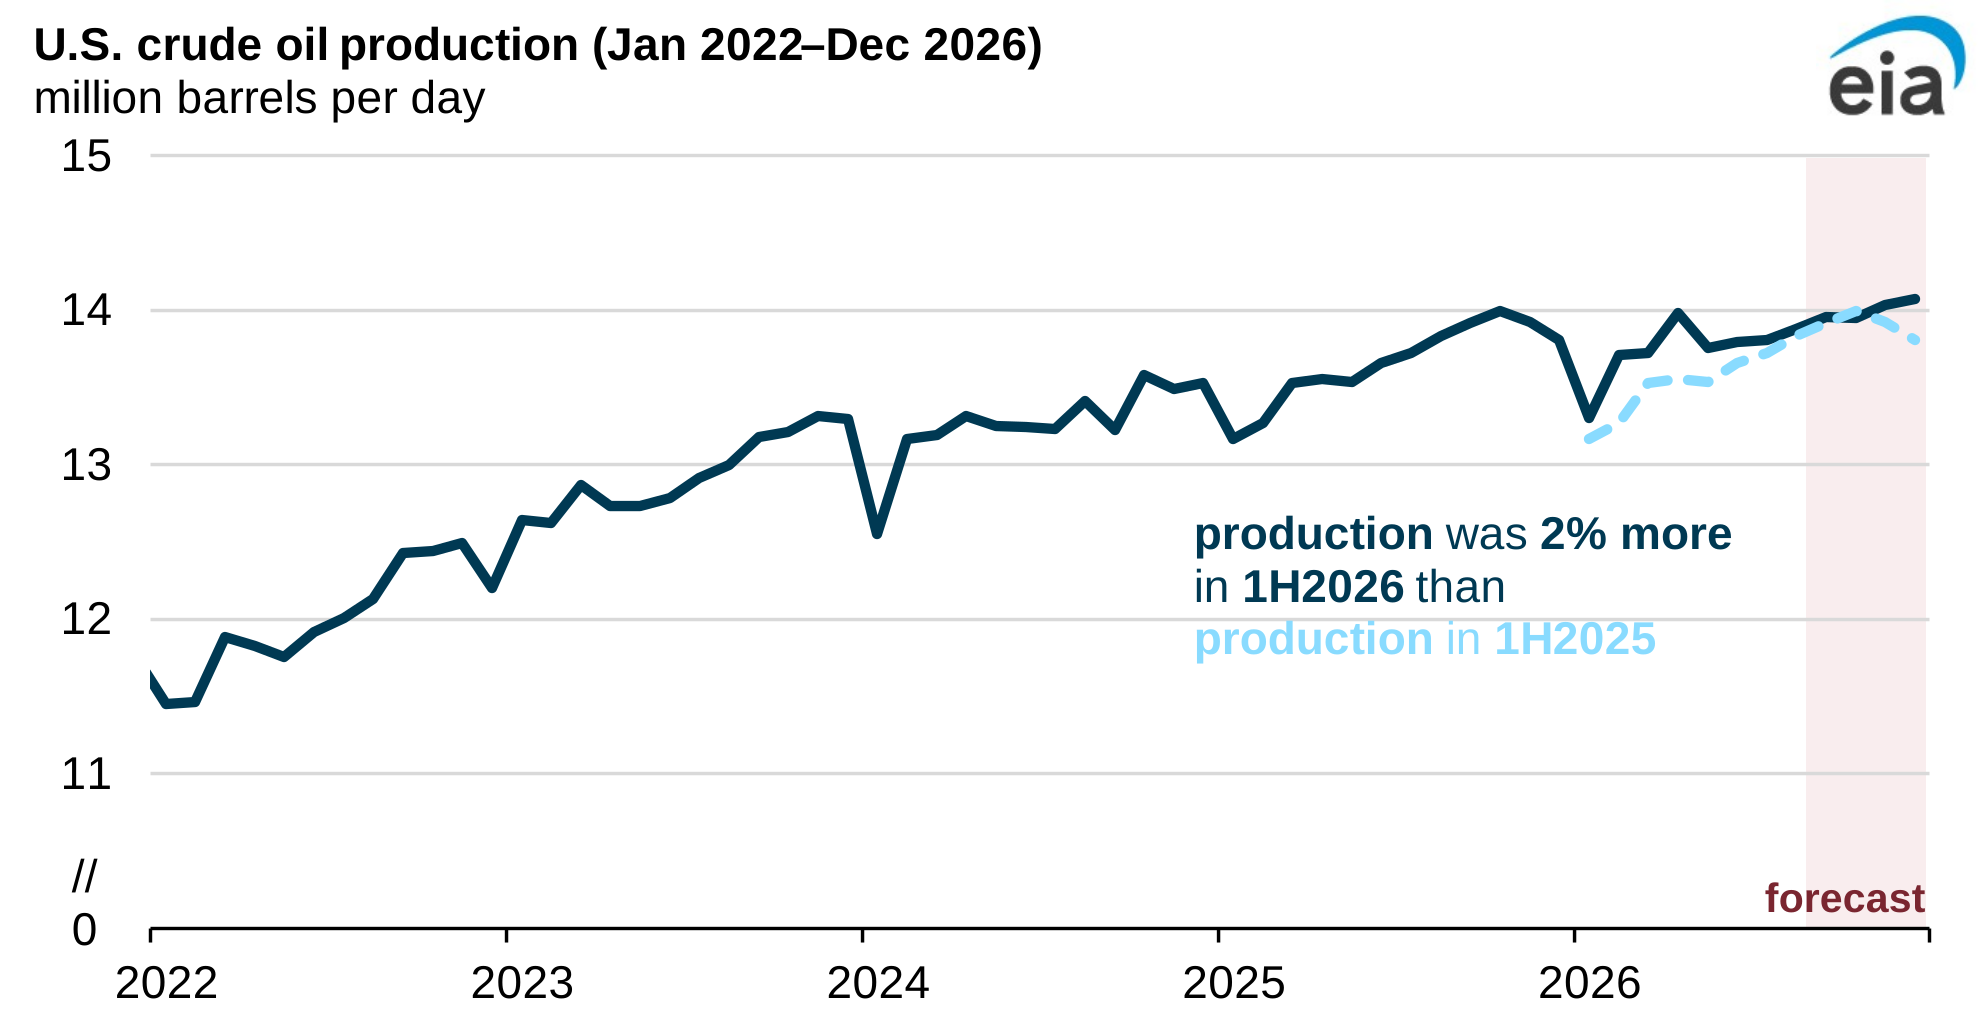
Data source: U.S. Energy Information Administration, Short-Term Energy OutlookSeptember 2026
Note: 1H2026=first half of 2026
We forecast U.S. crude oil production will average 13.8 million barrels per day (b/d) in 2026, surpassing the previous record of 13.7 million b/d set in 2025, in our latest Short-Term Energy Outlook (STEO).
In-brief analysis
Sep 9, 2026
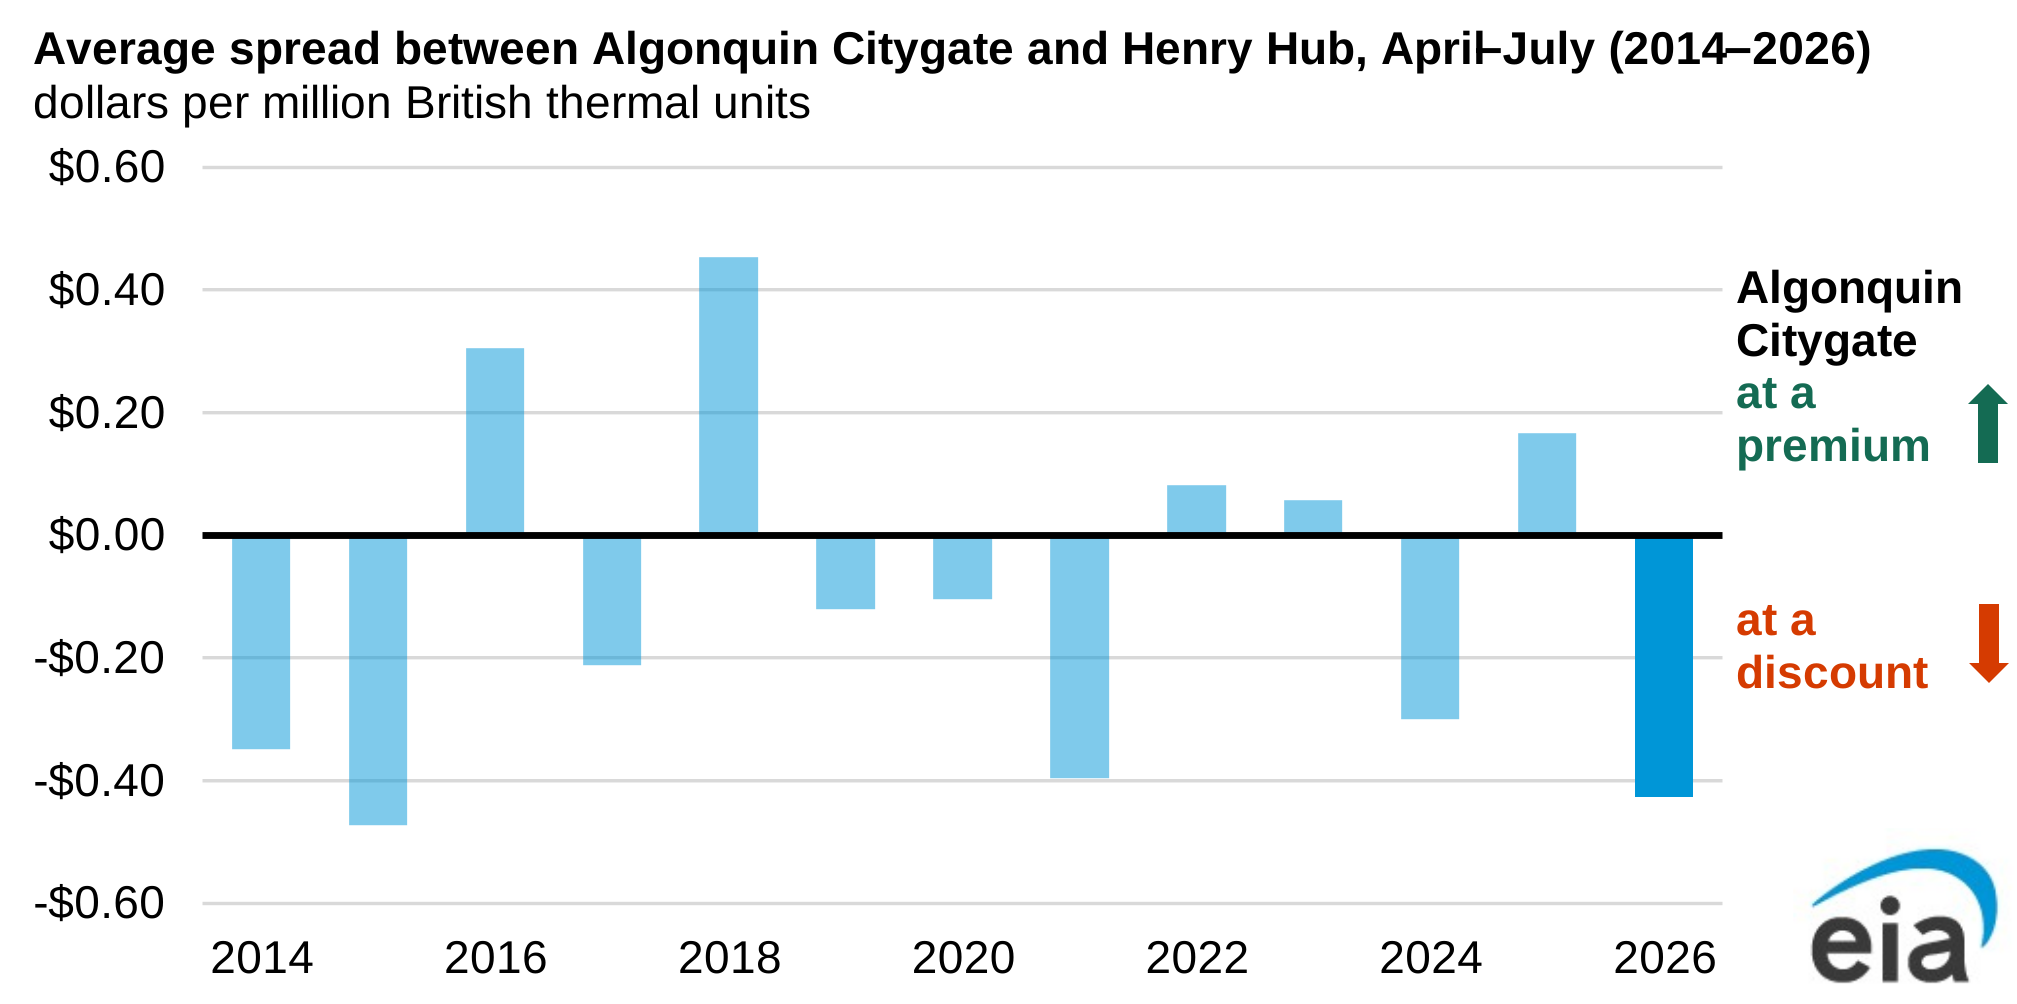
Data source: Natural Gas Intelligence
Low-cost Appalachian and Canadian natural gas supplies coupled with lower-than-usual regional consumption have pushed down natural gas prices at a major New England pricing hub in recent months to trade at a discount to the widely cited U.S. benchmark, Henry Hub.
In-brief analysis
Sep 4, 2026
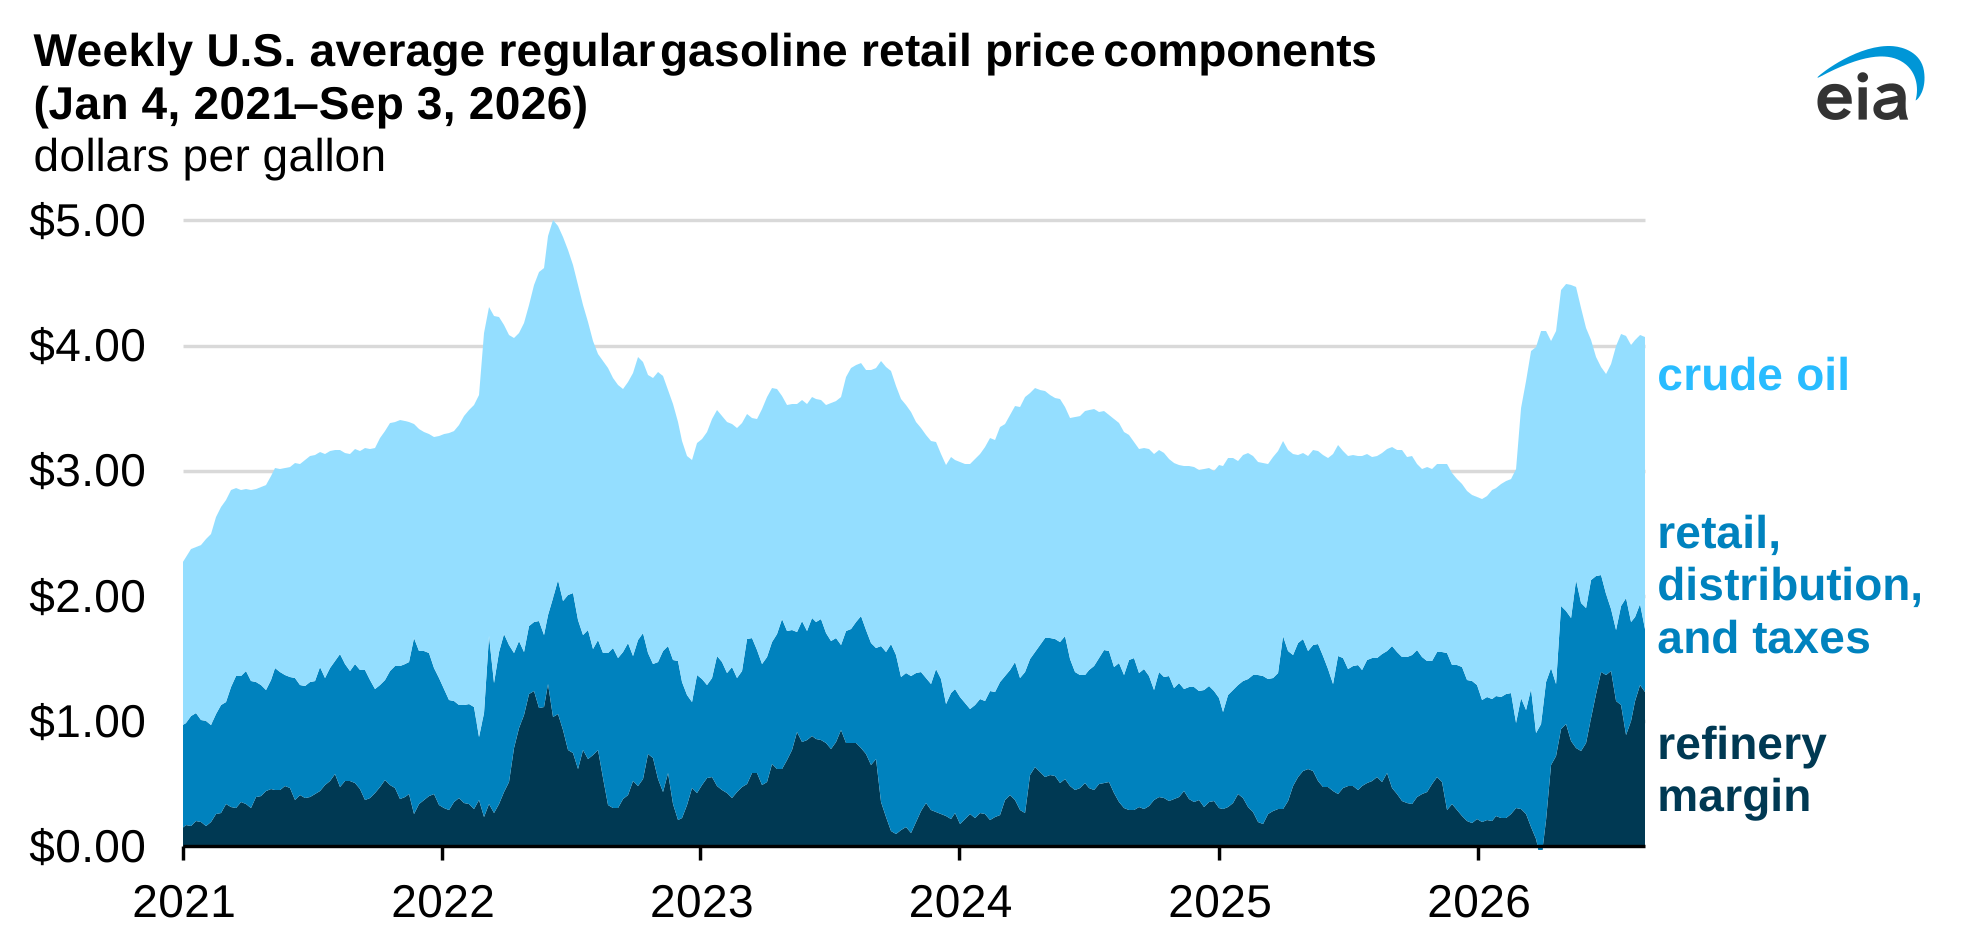
Data source: U.S. Energy Information Administration, Gasoline and Diesel Fuel Update; Bloomberg L.P.
Note: The data for the week ending September 5 are estimated based on data through September 3. Refinery margin is calculated as the difference between the price of a gallon of wholesale gasoline at New York Harbor and the spot market price of a gallon of Brent crude oil. Retail, distribution, and taxes captures retail margins, distribution costs, and federal and state taxes; it is calculated as the difference between the U.S. average regular gasoline retail price and the wholesale gasoline price at New York Harbor. Crude oil reflects the spot market price of a gallon of Brent crude oil.
What are crack spreads and why are they elevated?
Crack spreads are indicators of the profitability of refining crude oil into petroleum products such as gasoline and diesel. One common crack spread is calculated by subtracting the spot market price of a gallon of crude oil from the wholesale price of a gallon of refined product. Since May, the gasoline crack spread in New York Harbor has averaged about $1 per gallon (gal) higher than in 2025, when the crack spread peaked around 60 cents/gal. Gasoline crack spreads are elevated primarily because of tight gasoline supplies globally.
In-brief analysis
Sep 3, 2026
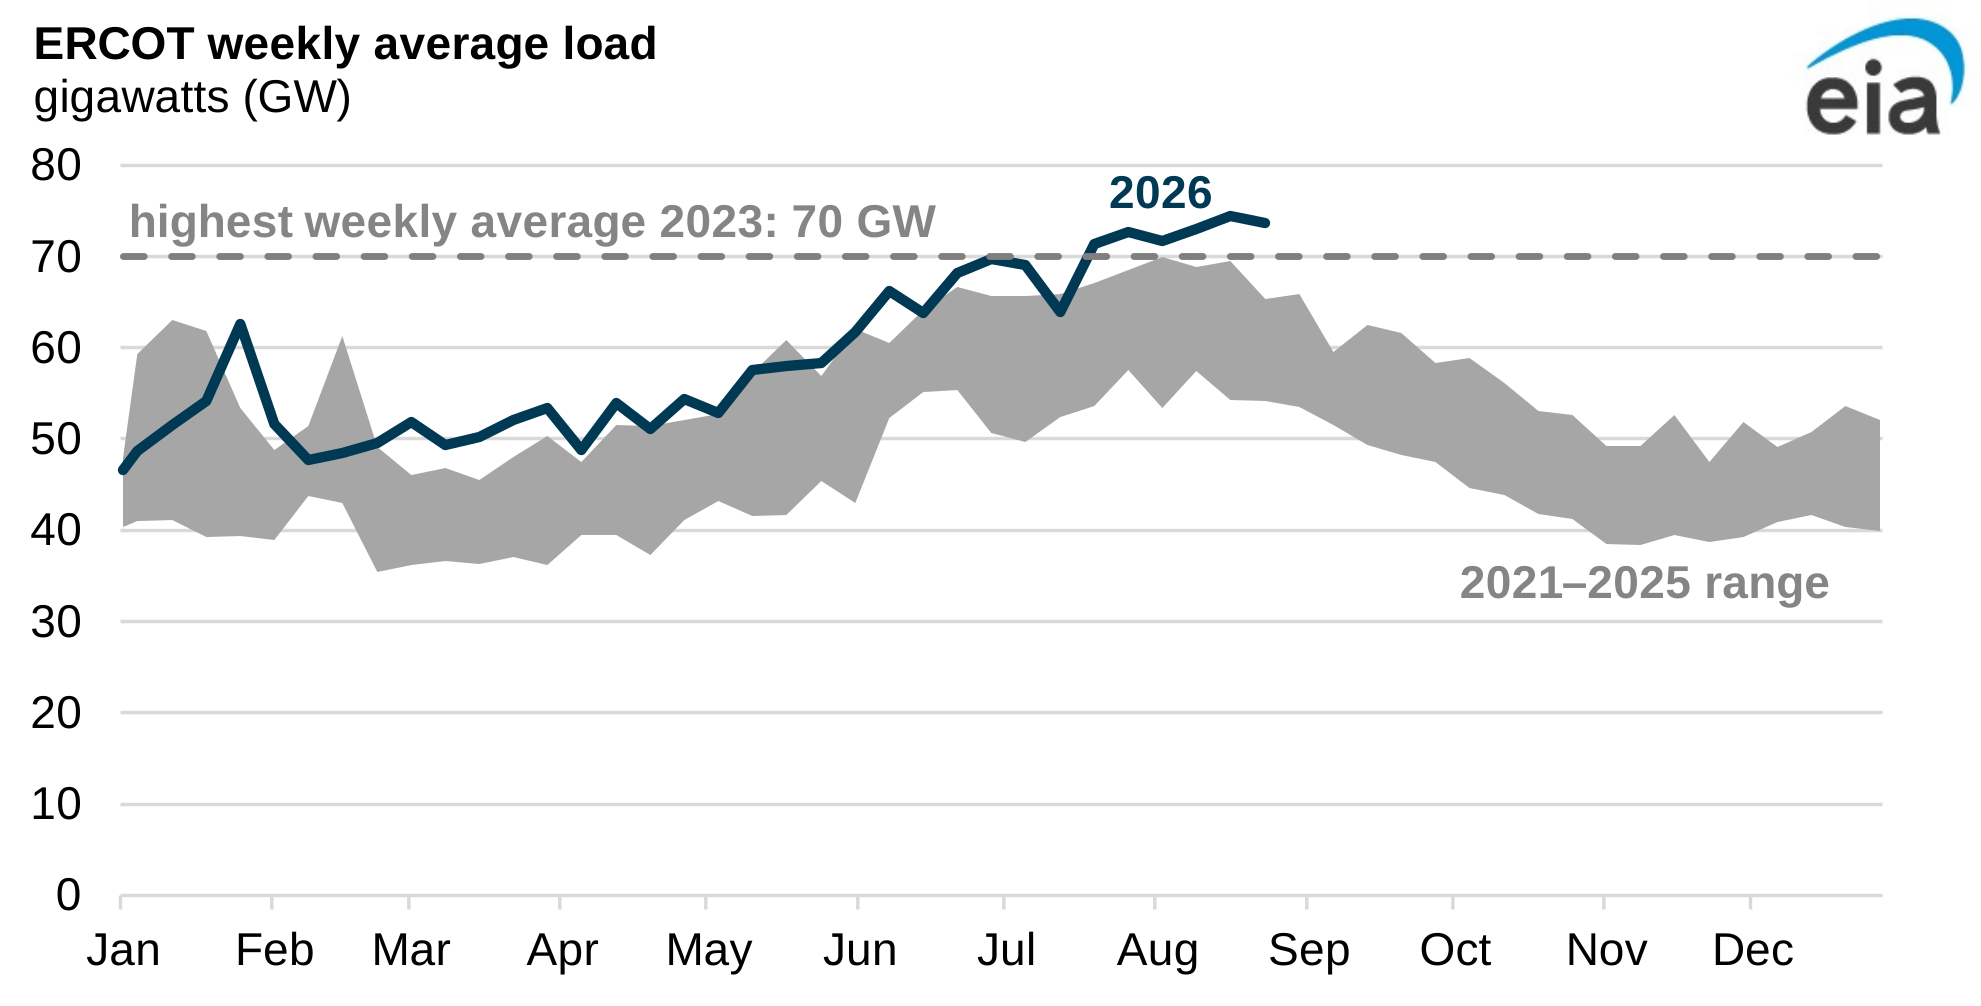
Data source: U.S. Energy Information Administration, Hourly Electric Grid Monitor
Note: ERCOT=Electric Reliability Council of Texas. Weekly average load is based on hourly data that are averaged across the week.
Sustained high temperatures have contributed to persistently high electricity demand in the Electric Reliability Council of Texas (ERCOT), the regional transmission organization for most of the state:
In-brief analysis
Sep 1, 2026
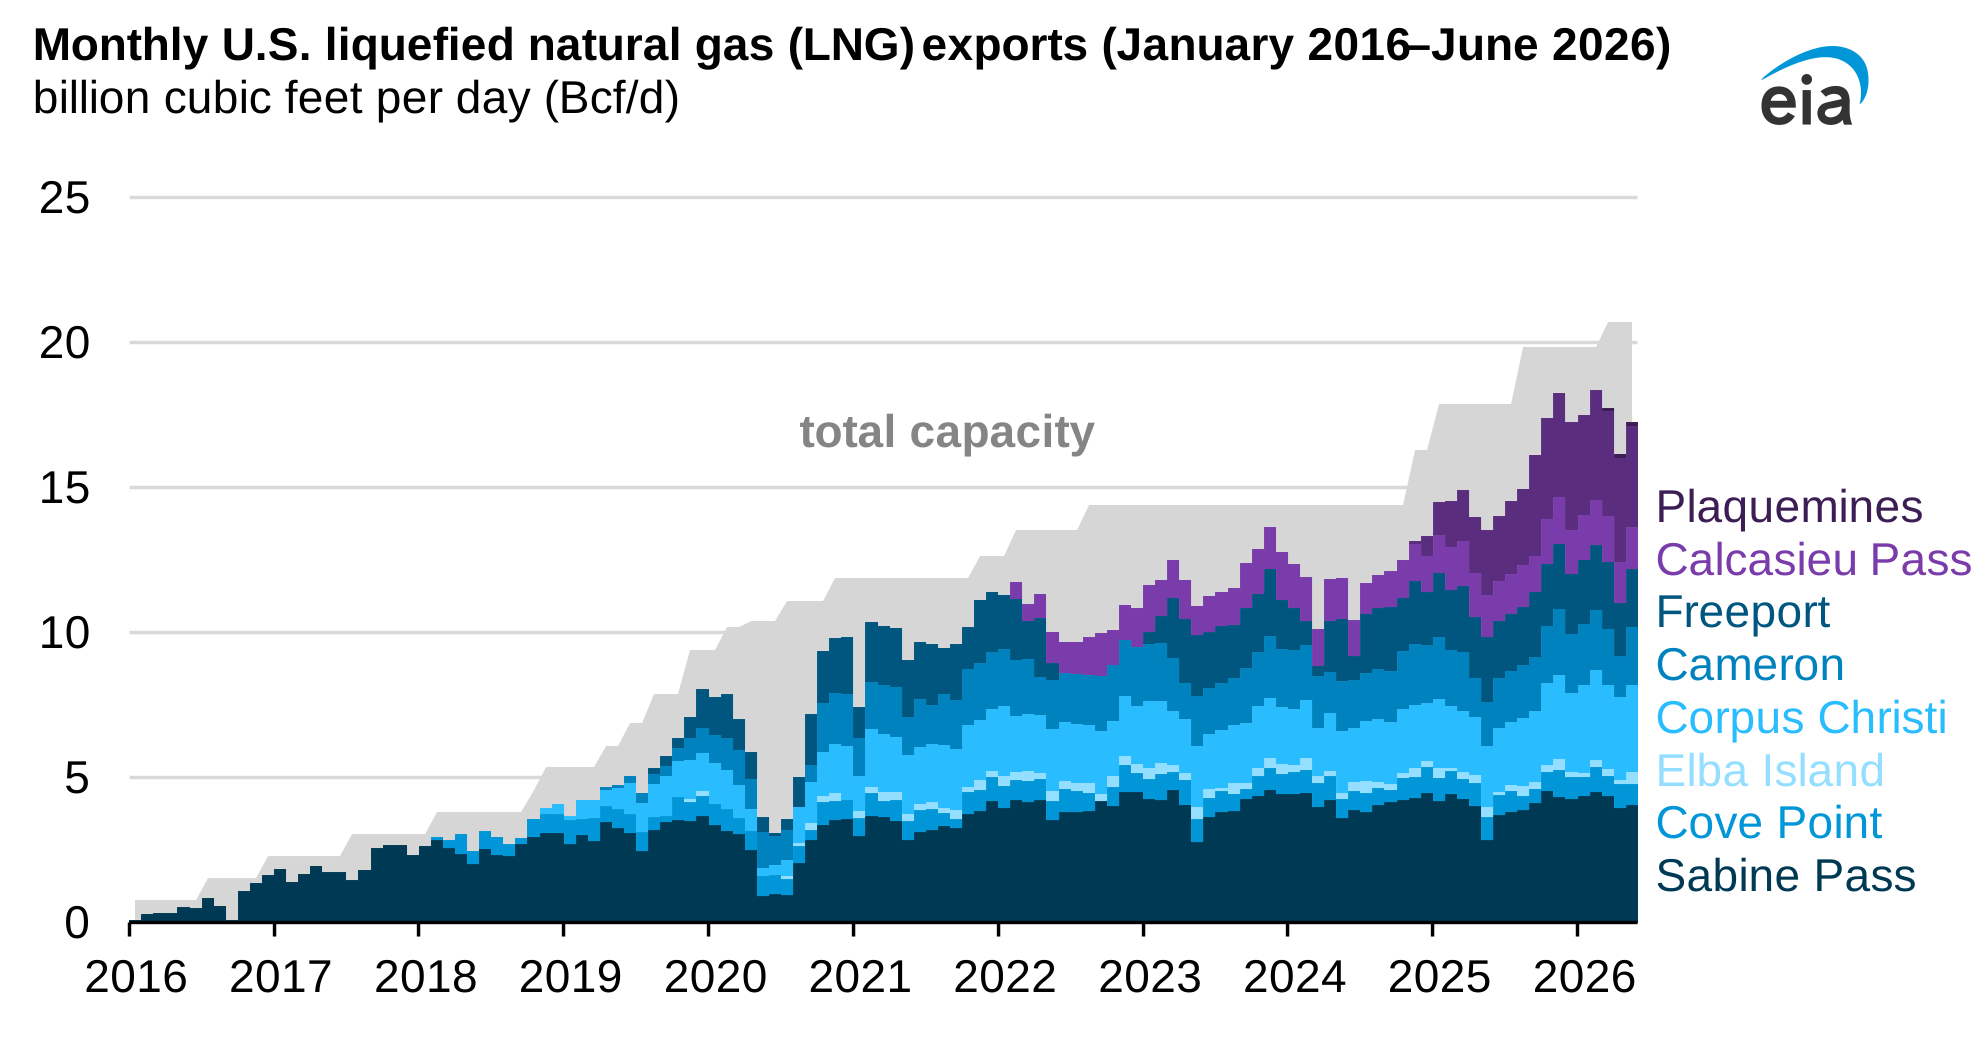
U.S. liquefied natural gas (LNG) exports averaged 17.4 billion cubic feet per day (Bcf/d) in the first six months of the year, 23% more than the same period in 2025, according to our Natural Gas Monthly. In our latest Short-Term Energy Outlookwe estimate U.S. LNG exports will average 17.3 Bcf/d in the second half of 2026 (2H26) before rising to 18.7 Bcf/d in 1H27.
In-brief analysis
Aug 28, 2026
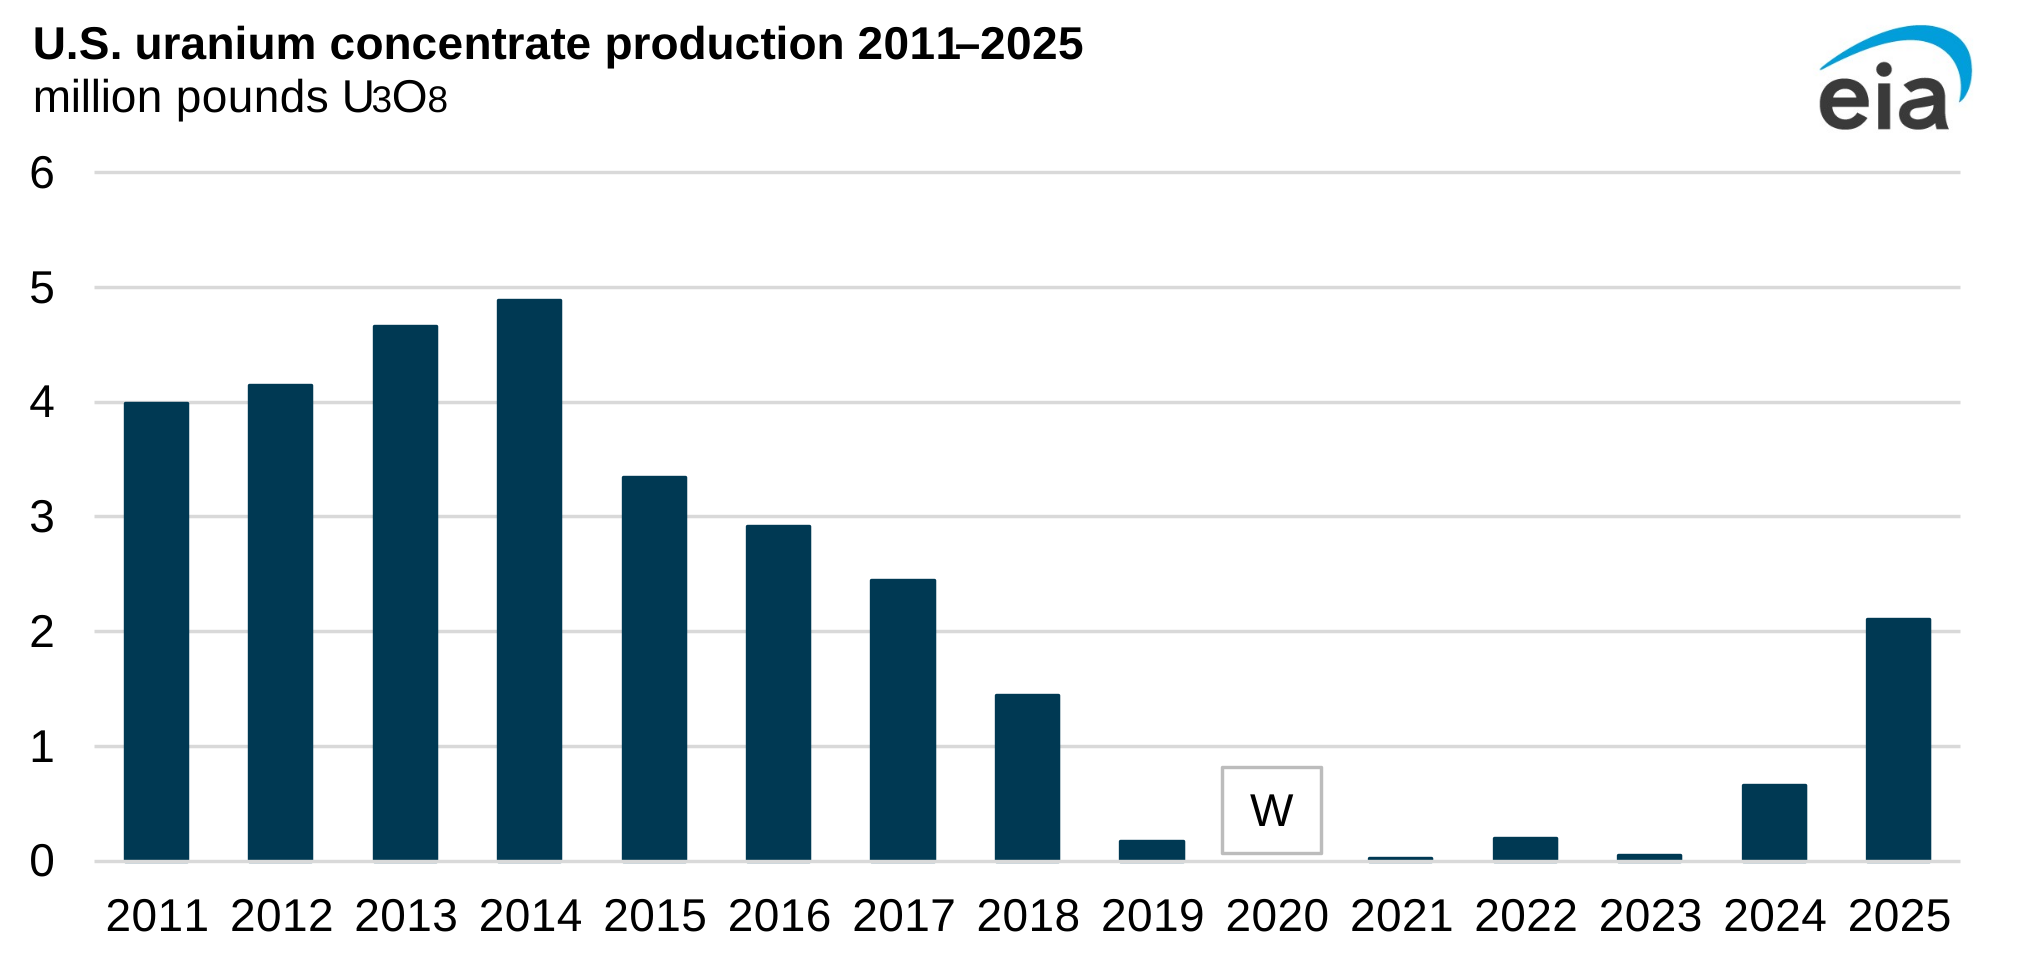
In 2025, uranium concentrate production in the United States totaled 2.1 million pounds of triuranium octoxide (U3O8), the base component of nuclear reactor fuel. U.S. U3O8 production in 2025 was the most since 2017 and more than triple the volume produced in 2024.
Source: www.eia.gov